31 de diciembre de 2023 a las 13:11 // Precio
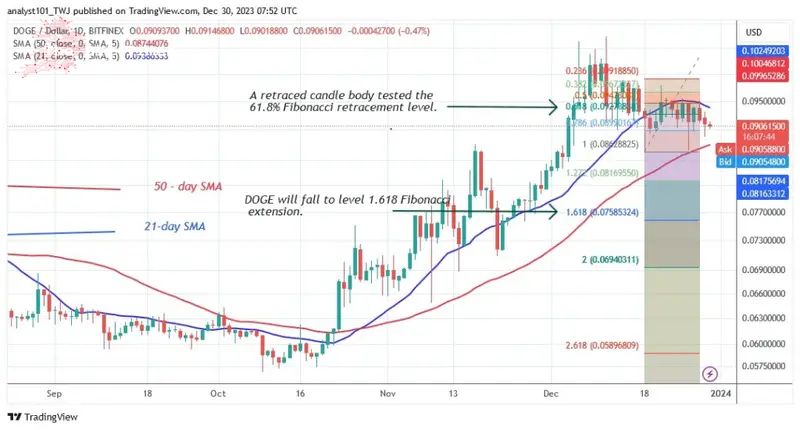
DOGE has been trapped between moving average lines over the past week. Buyers tried unsuccessfully to bring the price back above the 21-day SMA.
DOGE ha quedado atrapado entre líneas de media móvil durante la semana pasada. Los compradores intentaron sin éxito hacer que el precio volviera a superar la SMA de 21 días.
Long-term outlook for Dogecoin price: bearish
Perspectiva a largo plazo para el precio de Dogecoin: bajista
Dogecoin (DOGE) price is expected to decline further if it breaks below the 21-day SMA on December 19.
Se espera que el precio de Dogecoin (DOGE) baje aún más si cae por debajo de la SMA de 21 días el 19 de diciembre.
On Dec. 26, the bears pushed the price above the 50-day simple moving average, but the bulls bought the dips. The bears now have the upper hand and DOGE is falling. The cryptocurrency will test the support of the 50-day simple moving average. According to the price indicator, DOGE will fall to the Fibonacci extension of $1.618 or the low of $0.075.
El 26 de diciembre, los bajistas empujaron el precio por encima del promedio móvil simple de 50 días, pero los alcistas compraron las caídas. Los bajistas ahora tienen la ventaja y DOGE está cayendo. La criptomoneda probará el soporte del promedio móvil simple de 50 días. Según el indicador de precios, DOGE caerá hasta la extensión de Fibonacci de 1,618 dólares o el mínimo de 0,075 dólares.
Dogecoin indicator analysis
Análisis del indicador Dogecoin
DOGE's price bars have gotten caught between the moving average lines. If the moving average lines are broken, DOGE will develop a trend. Selling pressure will intensify if the price of DOGE falls below the moving average lines.
Las barras de precios de DOGE quedaron atrapadas entre las líneas de media móvil. Si las líneas de la media móvil se rompen, DOGE desarrollará una tendencia. La presión de venta se intensificará si el precio de DOGE cae por debajo de las líneas de media móvil.
Technical Indicators
Indicadores Técnicos
Key resistance levels – $0.12 and $0.14
Niveles de resistencia clave: $0,12 y $0,14
Key support levels – $0.06 and $0.04
Niveles de soporte clave: $0,06 y $0,04
What is the next direction for Dogecoin?
¿Cuál es la próxima dirección para Dogecoin?
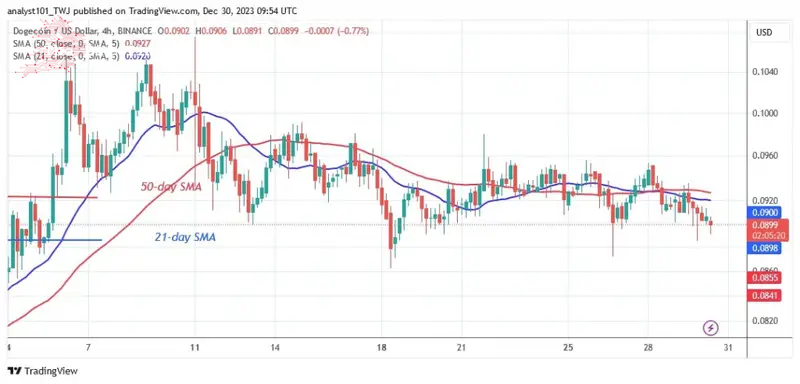
DOGE is moving sideways on the 4-hour chart. The price of the altcoin is fluctuating between $0.086 and $0.097. Doji candlesticks, which have a small body and are indecisive, have characterised the price action. Doji candlesticks are rigid and restrict the price movement.
DOGE se mueve lateralmente en el gráfico de 4 horas. El precio de la altcoin fluctúa entre $0,086 y $0,097. Las velas Doji, que tienen un cuerpo pequeño y son indecisas, han caracterizado la acción del precio. Las velas Doji son rígidas y restringen el movimiento de precios.
Disclaimer. This Analysis and forecast are the personal opinions of the author and are not a recommendation to buy or sell cryptocurrency and should not be viewed as an endorsement by CoinIdol.com. Readers should do the research before investing in funds.
Descargo de responsabilidad. Este análisis y pronóstico son opiniones personales del autor y no son una recomendación para comprar o vender criptomonedas y no deben verse como un respaldo por parte de CoinIdol.com. Los lectores deben investigar antes de invertir en fondos.
Source: https://thebittimes.com/doge-falls-to-0-095-in-the-face-of-further-rejections-tbt75247.html
Fuente: https://thebittimes.com/doge-falls-to-0-095-in-the-face-of-further-rejections-tbt75247.html


 Crypto Intelligence
 DogeHome
 CFN
CFN The Bit Journal
 Crypto Intelligence
 DeFi Planet
 Crypto News Land
 BH NEWS
 DogeHome


