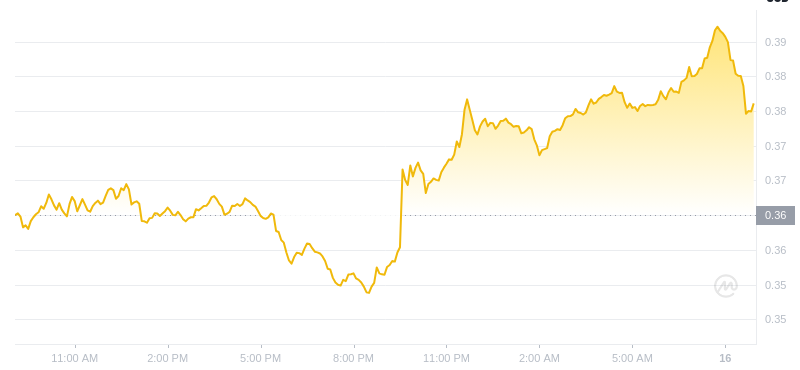
The Dogecoin price is indeed experiencing a significant surge. Whether it will double in price depends on various factors, including market sentiment and external events.
De hecho, el precio de Dogecoin está experimentando un aumento significativo. Que su precio se duplique depende de varios factores, incluido el sentimiento del mercado y los acontecimientos externos.
The indicators currently suggest bullish momentum, with a golden crossover of the Exponential Moving Averages (EMAs) in Dogecoin’s weekly chart indicating a bullish trend in the medium term. Additionally, Dogecoin has shown impressive gains against Bitcoin, rising approximately 67.5% since February, despite Bitcoin’s potential for a new all-time high (ATH).
Los indicadores actualmente sugieren un impulso alcista, con un cruce dorado de las medias móviles exponenciales (EMA) en el gráfico semanal de Dogecoin que indica una tendencia alcista en el mediano plazo. Además, Dogecoin ha mostrado ganancias impresionantes frente a Bitcoin, aumentando aproximadamente un 67,5% desde febrero, a pesar del potencial de Bitcoin para alcanzar un nuevo máximo histórico (ATH).
Dogecoin Jumps 122.4% in February – Will the Trend Continue?
Dogecoin salta un 122,4% en febrero: ¿Continuará la tendencia?
Dogecoin has experienced a remarkable surge in just over a month, marking a 122% increase in price. Breaking the golden ratio resistance at around $0.12 has paved the way for further gains, with significant Fibonacci resistances now at $0.31 and $0.48, suggesting a potential upside of 93%.
Dogecoin ha experimentado un aumento notable en poco más de un mes, marcando un aumento de precio del 122%. Romper la resistencia de la proporción áurea en alrededor de 0,12 dólares ha allanado el camino para mayores ganancias, con importantes resistencias de Fibonacci ahora en 0,31 dólares y 0,48 dólares, lo que sugiere un potencial alcista del 93%.
A breakthrough at $0.48 would signal a new bullish trend, potentially propelling Dogecoin to surpass its all-time high of around $0.74. The monthly Moving Average Convergence/Divergence (MACD) histogram indicates an uptrend, with the bullish crossover of MACD lines, while the RSI remains neutral.
Un avance de 0,48 dólares indicaría una nueva tendencia alcista, lo que podría impulsar a Dogecoin a superar su máximo histórico de alrededor de 0,74 dólares. El histograma mensual de convergencia/divergencia de la media móvil (MACD) indica una tendencia alcista, con el cruce alcista de las líneas MACD, mientras que el RSI permanece neutral.
Gráfico de precios DOGE/USDT. Fuente: Tradingview
Golden Crossover Confirmed in Weekly Chart
Golden Crossover confirmado en el gráfico semanal
The weekly chart for Dogecoin reveals a bullish outlook as the EMAs have formed a golden crossover, confirming the medium-term trend. Additionally, the MACD lines are crossed in a bullish manner, and the MACD histogram is showing bullish momentum.
El gráfico semanal de Dogecoin revela una perspectiva alcista ya que las EMA han formado un cruce dorado, lo que confirma la tendencia a medio plazo. Además, las líneas MACD se cruzan de manera alcista y el histograma MACD muestra un impulso alcista.
Read More: Dogecoin (DOGE) Price Prediction 2024/2025/2030
Leer más: Predicción del precio de Dogecoin (DOGE) 2024/2025/2030
Gráfico de precios DOGE/USDT. Fuente: Tradingview
Despite the strong bullish performance last week, caution is advised as the Relative Strength Index (RSI) indicator is now in overbought regions on the weekly chart. However, it’s important to note that there is no clear bearish divergence observed in the RSI.
A pesar del fuerte desempeño alcista de la semana pasada, se recomienda precaución ya que el indicador del índice de fuerza relativa (RSI) se encuentra ahora en regiones de sobrecompra en el gráfico semanal. Sin embargo, es importante tener en cuenta que no se observa una divergencia bajista clara en el RSI.
Bullish Signals in Dogecoin’s Daily Chart
Señales alcistas en el gráfico diario de Dogecoin
On the daily chart, Dogecoin also exhibits a bullish trend, confirmed by a golden crossover of the EMAs, indicating short to medium-term bullishness. The MACD histogram displays upward momentum, and the MACD lines are crossed bullishly.
En el gráfico diario, Dogecoin también muestra una tendencia alcista, confirmada por un cruce dorado de las EMA, lo que indica un optimismo a corto y medio plazo. El histograma MACD muestra un impulso alcista y las líneas MACD se cruzan alcistamente.
Gráfico de precios DOGE/USDT. Fuente: Tradingview
However, caution is warranted as the RSI indicates heavily overbought conditions. Nonetheless, there are no indications of a bearish divergence at this point.
Sin embargo, se recomienda precaución ya que el RSI indica condiciones de gran sobrecompra. Sin embargo, no hay indicios de una divergencia bajista en este momento.
Emerging Bearish Divergence on Dogecoin’s 4H Chart
Divergencia bajista emergente en el gráfico 4H de Dogecoin
On Dogecoin’s 4-hour chart, a bearish divergence is noticeable amidst the parallel upward channel. However, the MACD lines remain crossed bullishly, and the MACD histogram shows upward momentum.
En el gráfico de 4 horas de Dogecoin, se nota una divergencia bajista en medio del canal ascendente paralelo. Sin embargo, las líneas MACD siguen cruzadas de forma alcista y el histograma MACD muestra un impulso alcista.
Read More: Dogecoin vs. Bitcoin: An Ultimate Comparison
Leer más: Dogecoin vs. Bitcoin: una comparación definitiva
Gráfico de precios DOGE/USDT. Fuente: Tradingview
Moreover, a golden crossover supports the short-term bullish trend. If a correction occurs, significant Fibonacci supports await around $0.1263 and $0.098, with additional support from the 50-4H and 200-4H EMAs.
Además, un cruce dorado respalda la tendencia alcista a corto plazo. Si se produce una corrección, importantes soportes de Fibonacci aguardan alrededor de USD 0,1263 y USD 0,098, con soporte adicional de las EMA de 50-4H y 200-4H.
DOGE Price Up 67.5% vs. BTC: What’s Next?
El precio de DOGE subió un 67,5% frente a BTC: ¿Qué sigue?
Despite a recent death cross against Bitcoin indicating a medium-term bearish trend, Dogecoin has shown significant strength against BTC, surging over 67.5% in the past week. The MACD histogram has turned bullish, MACD lines have crossed upwards, and the RSI is in neutral territory.
A pesar de un reciente cruce de muerte contra Bitcoin que indica una tendencia bajista a mediano plazo, Dogecoin ha mostrado una fuerza significativa contra BTC, subiendo más del 67,5% la semana pasada. El histograma MACD se ha vuelto alcista, las líneas MACD se han cruzado hacia arriba y el RSI se encuentra en territorio neutral.
Gráfico de precios de Dogecoin/Bitcoin. Fuente: Tradingview
Currently encountering resistance at the 200-week EMA around 0.00000261 BTC, a successful break could lead Dogecoin towards the next Fibonacci resistances at approximately 0.00000389 BTC and 0.00000533 BTC.
Actualmente encuentra resistencia en la EMA de 200 semanas alrededor de 0.00000261 BTC, una ruptura exitosa podría llevar a Dogecoin hacia las próximas resistencias de Fibonacci en aproximadamente 0.00000389 BTC y 0.00000533 BTC.
Read More: Dogecoin (DOGE) vs Shiba Inu (SHIB): What’s the Difference?
Leer más: Dogecoin (DOGE) vs Shiba Inu (SHIB): ¿Cuál es la diferencia?
Principales plataformas criptográficas | marzo 2024
Trusted
Confiable
Disclaimer
Descargo de responsabilidad
All the information contained on our website is published in good faith and for general information purposes only. Any action the reader takes upon the information found on our website is strictly at their own risk.
Toda la información contenida en nuestro sitio web se publica de buena fe y únicamente con fines de información general. Cualquier acción que el lector realice sobre la información que se encuentra en nuestro sitio web es estrictamente bajo su propio riesgo.


 CFN
CFN Crypto News Land
 Crypto News Land
 Crypto Intelligence
 DeFi Planet
 TheCoinrise Media
 TheCoinrise Media
 DogeHome
 crypto.news


