Dogecoin is showing bullish signs above the $0.0875 zone against the US Dollar. DOGE could extend its rally toward the $0.100 resistance in the near term.
Dogecoin muestra signos alcistas por encima de la zona de $ 0,0875 frente al dólar estadounidense. DOGE podría extender su repunte hacia la resistencia de $ 0,100 en el corto plazo.
- DOGE is showing positive signs above the $0.0875 zone against the US dollar.
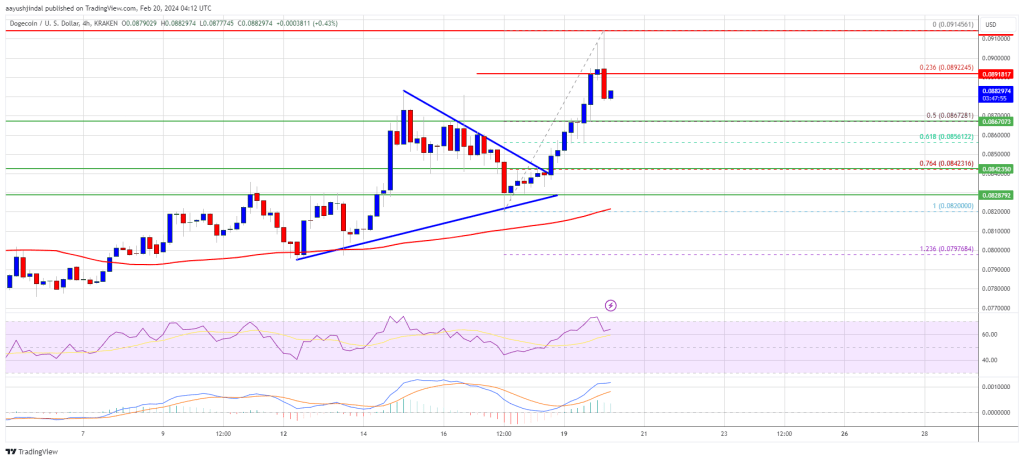
- The price is trading above the $0.0880 level and the 100 simple moving average (4 hours).
- There was a break above a key contracting triangle with resistance at $0.0842 on the 4-hour chart of the DOGE/USD pair (data source from Kraken).
- The price could extend its rally above the $0.090 and $0.092 resistance levels.
DOGE está mostrando signos positivos por encima de la zona de $ 0,0875 frente al dólar estadounidense.
El precio se cotiza por encima del nivel de $ 0,0880 y la media móvil simple de 100 (4 horas).
Hubo una ruptura por encima de un triángulo de contracción clave con una resistencia de $0,0842 en el gráfico de 4 horas del par DOGE/USD (fuente de datos de Kraken).
El precio podría extender su repunte por encima de los niveles de resistencia de $0,090 y $0,092.
Dogecoin Price Aims Higher
El precio de Dogecoin apunta más alto
In the past few sessions, Dogecoin price started a decent increase from the $0.082 support zone. DOGE cleared many hurdles near $0.0850 to enter a positive zone.
En las últimas sesiones, el precio de Dogecoin inició un aumento decente desde la zona de soporte de $ 0,082. DOGE superó muchos obstáculos cerca de USD 0,0850 para entrar en una zona positiva.
There was a break above a key contracting triangle with resistance at $0.0842 on the 4-hour chart of the DOGE/USD pair. It even broke the $0.0880 resistance to move further into a positive zone like Bitcoin and Ethereum. A high was formed near $0.0914 and the price is now correcting gains.
Hubo una ruptura por encima de un triángulo contractivo clave con una resistencia de $ 0,0842 en el gráfico de 4 horas del par DOGE/USD. Incluso rompió la resistencia de $ 0,0880 para avanzar hacia una zona positiva como Bitcoin y Ethereum. Se formó un máximo cerca de USD 0,0914 y el precio ahora está corrigiendo las ganancias.
There was a move below the 23.6% Fib retracement level of the recent wave from the $0.0820 swing low to the $0.0914 high. DOGE is also trading above the $0.0875 level and the 100 simple moving average (4 hours).
Hubo un movimiento por debajo del nivel de retroceso de Fibonacci del 23,6% de la ola reciente desde el mínimo de $ 0,0820 hasta el máximo de $ 0,0914. DOGE también cotiza por encima del nivel de $ 0,0875 y la media móvil simple de 100 (4 horas).
Source: DOGEUSD on TradingView.com
Fuente: DOGEUSD en TradingView.com
On the upside, the price is facing resistance near the $0.0892 level. The next major resistance is near the $0.0915 level. A close above the $0.0915 resistance might send the price toward the $0.095 resistance. The next major resistance is near $0.100. Any more gains might send the price toward the $0.120 level.
Por el lado positivo, el precio enfrenta una resistencia cercana al nivel de $ 0,0892. La siguiente gran resistencia está cerca del nivel de $ 0,0915. Un cierre por encima de la resistencia de $ 0,0915 podría enviar el precio hacia la resistencia de $ 0,095. La siguiente gran resistencia está cerca de 0,100 dólares. Cualquier ganancia adicional podría enviar el precio hacia el nivel de $ 0,120.
Downside Correction in DOGE?
¿Corrección a la baja en DOGE?
If DOGE’s price fails to gain pace above the $0.0915 level, it could start a downside correction. Initial support on the downside is near the $0.0865 level.
Si el precio de DOGE no logra acelerarse por encima del nivel de $ 0,0915, podría iniciar una corrección a la baja. El soporte inicial a la baja está cerca del nivel de $ 0,0865.
The next major support is near the $0.0855 level or the 61.8% Fib retracement level of the recent wave from the $0.0820 swing low to the $0.0914 high. If there is a downside break below the $0.0855 support, the price could decline further. In the stated case, the price might decline toward the $0.0820 level.
El siguiente soporte importante está cerca del nivel de $0,0855 o el nivel de retroceso de Fibonacci del 61,8% de la reciente ola desde el mínimo de $0,0820 hasta el máximo de $0,0914. Si hay una ruptura a la baja por debajo del soporte de $ 0,0855, el precio podría caer aún más. En el caso indicado, el precio podría caer hacia el nivel de $ 0,0820.
Technical Indicators
Indicadores Técnicos
4 Hours MACD – The MACD for DOGE/USD is now losing momentum in the bullish zone.
MACD de 4 horas: el MACD para DOGE/USD ahora está perdiendo impulso en la zona alcista.
4 Hours RSI (Relative Strength Index) – The RSI for DOGE/USD is now above the 50 level.
RSI (índice de fuerza relativa) de 4 horas: el RSI para DOGE/USD ahora está por encima del nivel 50.
Major Support Levels – $0.0865, $0.0855 and $0.0820.
Principales niveles de soporte: $0,0865, $0,0855 y $0,0820.
Major Resistance Levels – $0.0915, $0.095, and $0.10.
Niveles de resistencia principales: $0,0915, $0,095 y $0,10.
Descargo de responsabilidad: el artículo se proporciona únicamente con fines educativos. No representa las opiniones de NewsBTC sobre si comprar, vender o mantener inversiones y, naturalmente, invertir conlleva riesgos. Se recomienda realizar su propia investigación antes de tomar cualquier decisión de inversión. Utilice la información proporcionada en este sitio web bajo su propio riesgo.
Etiquetas: DOGE/BTCDogecoindogeusddogeusdt


 DeFi Planet
 TheCoinrise Media
 TheCoinrise Media
 DogeHome
 crypto.news
 Crypto Intelligence
 crypto.news
 DogeHome
 Crypto Intelligence


