Exploring Dogecoin's Market Trends and Technical Analysis
Explorando las tendencias del mercado y el análisis técnico de Dogecoin
In the cryptocurrency market dominated by Bitcoin, a trend is emerging that evokes fear and anxiety among investors. Post-halving, the anticipation of an upswing continues to dwindle. However, during this time, numerous memecoin projects are gaining prominence, including Dogecoin. Let's delve into the prospects for Dogecoin in the near future.
En el mercado de las criptomonedas dominado por Bitcoin, está surgiendo una tendencia que evoca miedo y ansiedad entre los inversores. Después del halving, las expectativas de un repunte siguen disminuyendo. Sin embargo, durante este tiempo, numerosos proyectos de memecoins están ganando protagonismo, incluido Dogecoin. Profundicemos en las perspectivas de Dogecoin en un futuro próximo.
Dogecoin Chart Analysis
Análisis de gráficos de Dogecoin
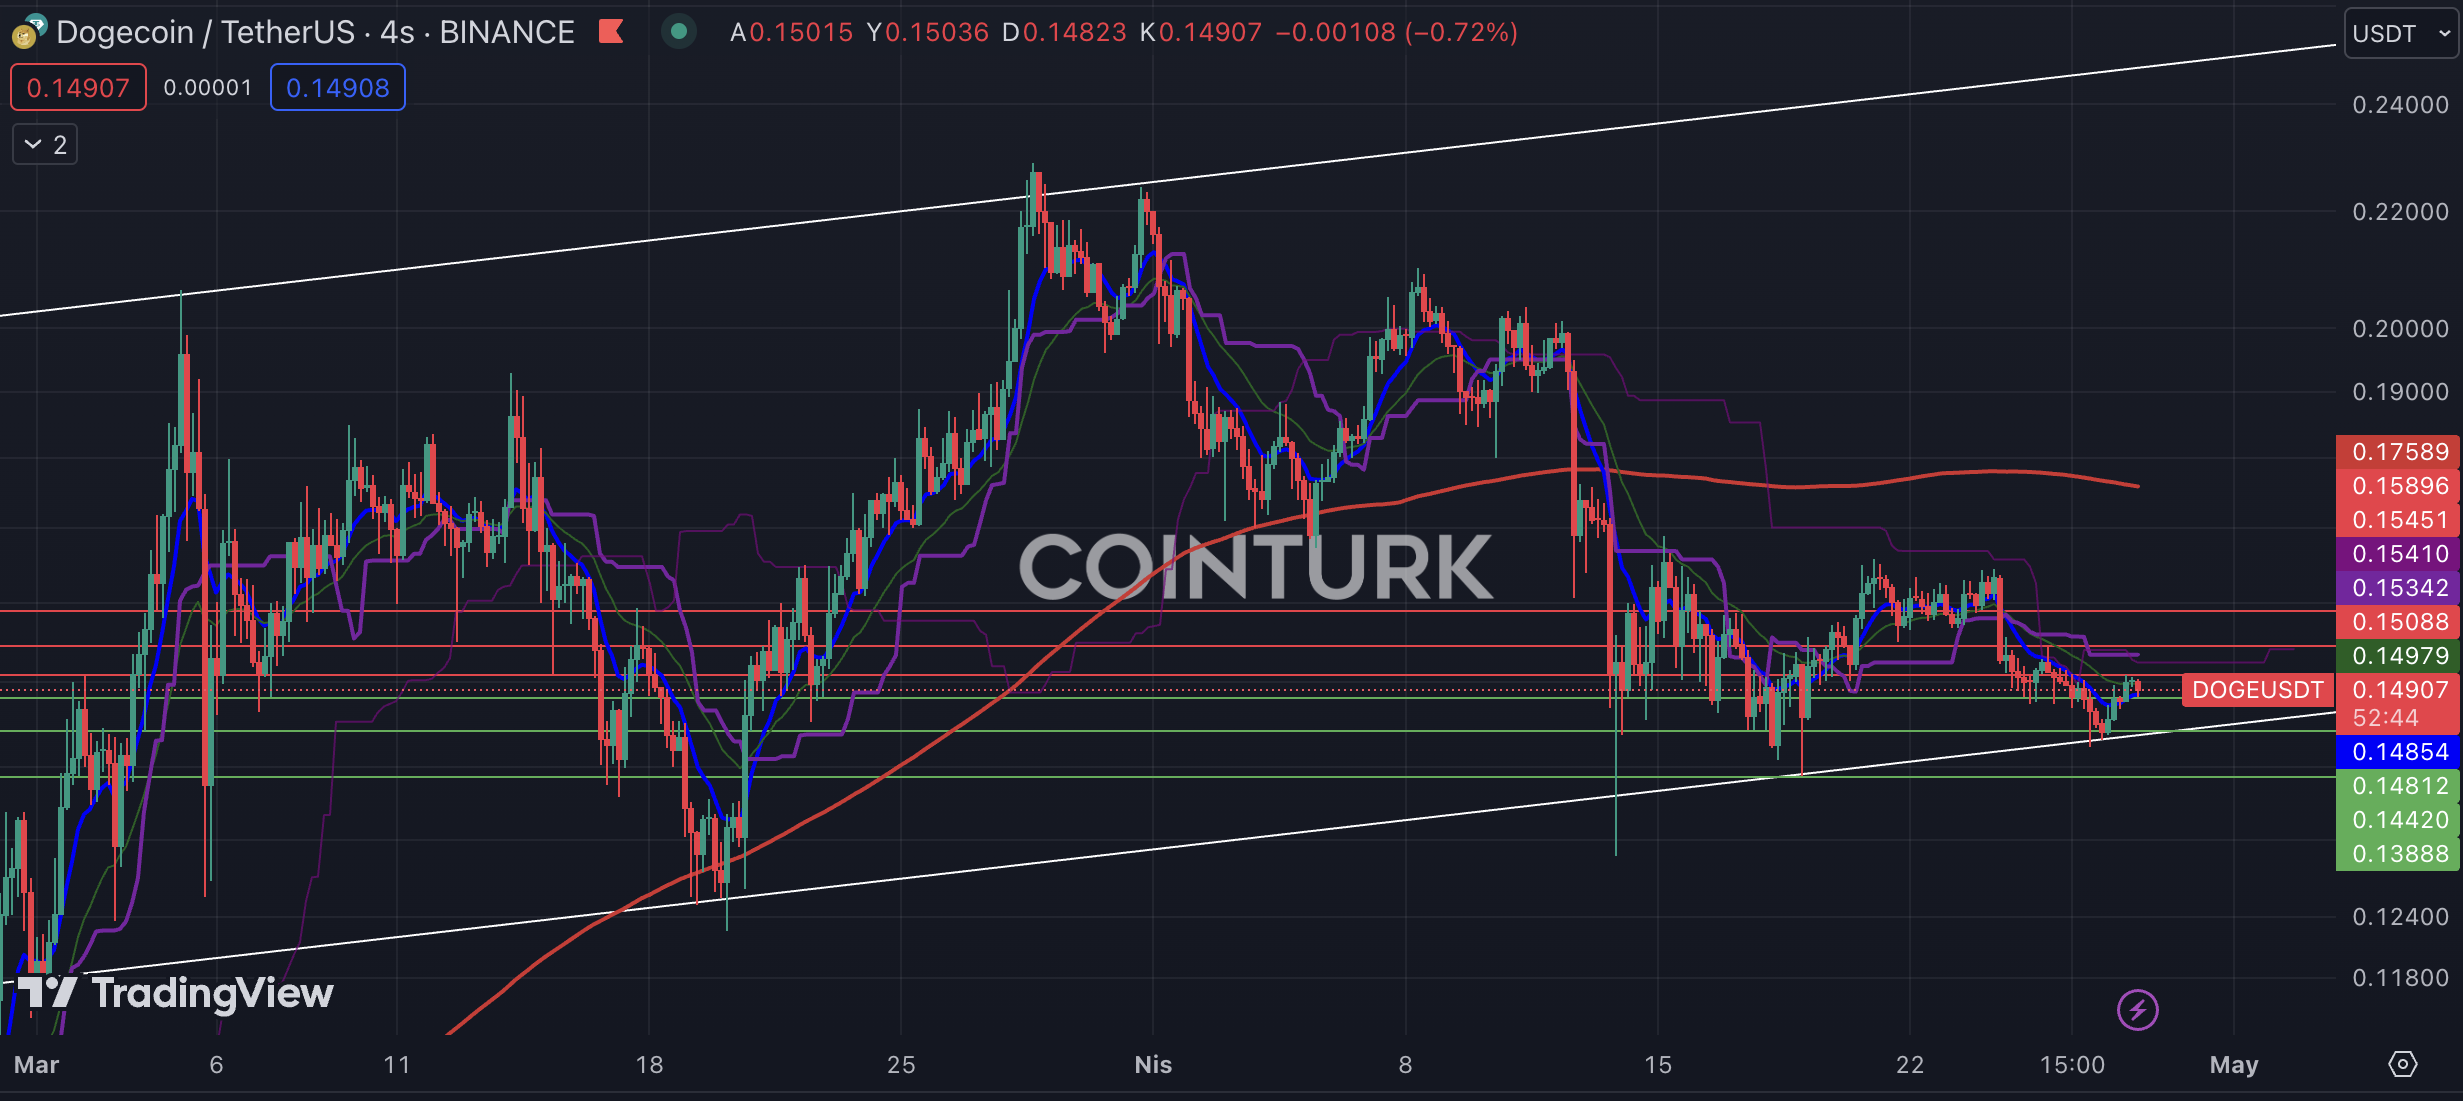
The four-hour DOGE chart offers valuable insights for investors with its ascending channel pattern. After reaching the most recent support level, DOGE ascended above the EMA 9 (blue line) but remains below the EMA 21 (green line).
El gráfico DOGE de cuatro horas ofrece información valiosa para los inversores con su patrón de canal ascendente. Después de alcanzar el nivel de soporte más reciente, DOGE ascendió por encima de la EMA 9 (línea azul) pero permanece por debajo de la EMA 21 (línea verde).
Support Levels:
Niveles de soporte:
- 0.1481 / 0.1442
- 0.1388
A four-hour bar closing beneath the 0.1481 level, which coincides with the EMA 9, could weaken DOGE's momentum and create selling pressure.
0.1481 / 0.14420.1388 Una barra de cuatro horas que cierra por debajo del nivel 0.1481, que coincide con la EMA 9, podría debilitar el impulso de DOGE y crear presión de venta.
Resistance Levels:
Niveles de resistencia:
- 0.1508 / 0.1545
- 0.1589
Conversely, a four-hour bar closing above the 0.1508 level, which intersects with the EMA 21, could enhance DOGE's momentum and present significant opportunities for investors.
0.1508 / 0.15450.1589 Por el contrario, una barra de cuatro horas que cierre por encima del nivel de 0.1508, que se cruza con la EMA 21, podría mejorar el impulso de DOGE y presentar importantes oportunidades para los inversores.

DOGE/ETH Chart Analysis
Análisis de gráficos DOGE/ETH
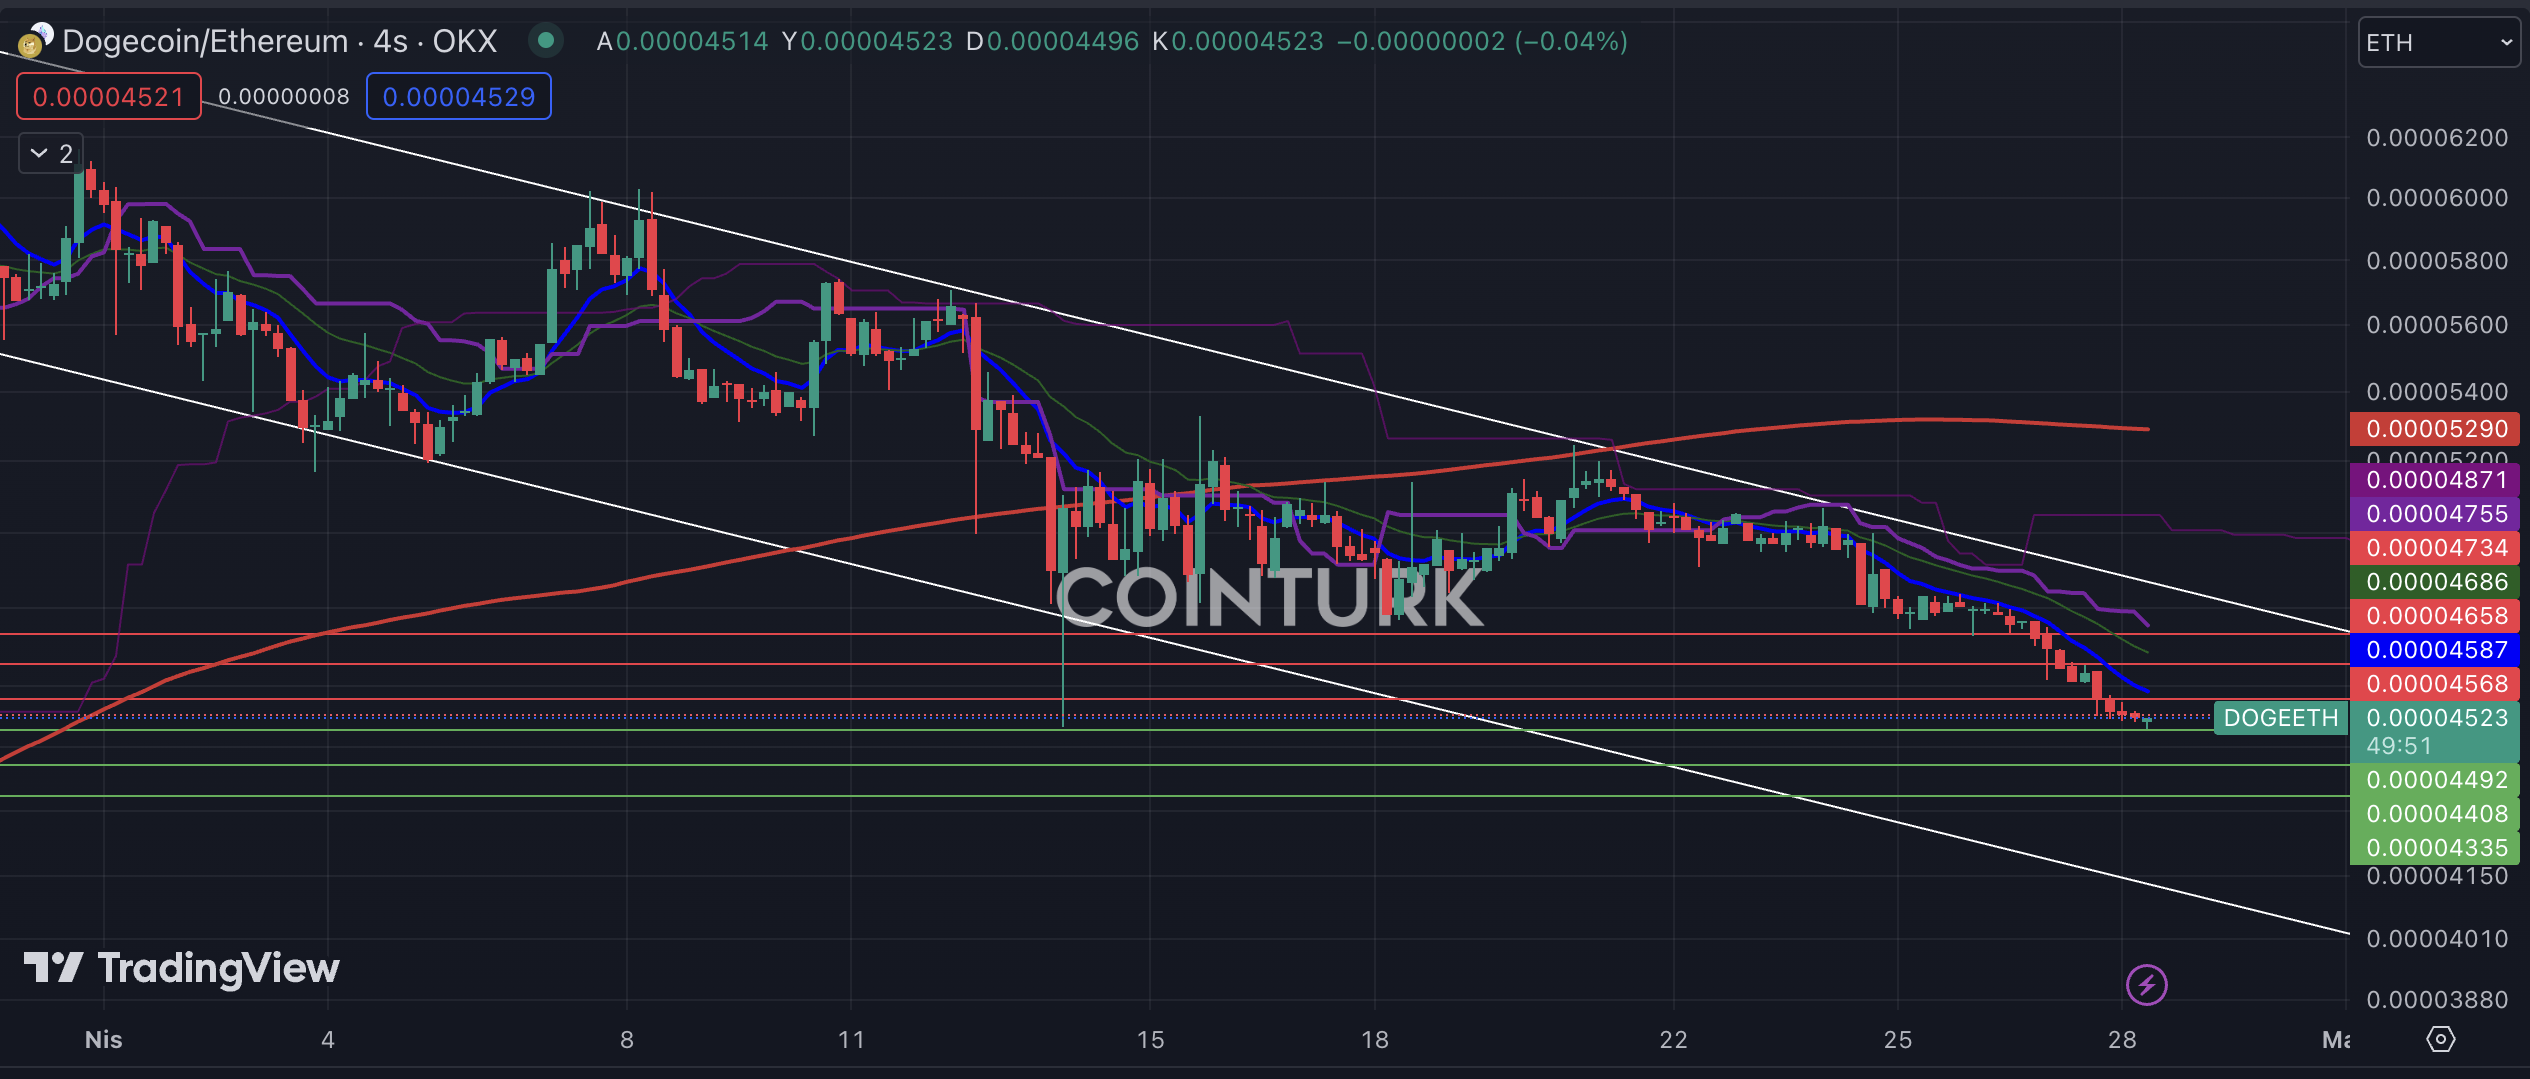
The four-hour DOGE/ETH chart exhibits a descending channel pattern, indicating that DOGE continues to depreciate against Ethereum. This chart holds significant relevance within the Ethereum ecosystem, and the rising selling pressure could create buying opportunities for DOGE.
El gráfico DOGE/ETH de cuatro horas muestra un patrón de canal descendente, lo que indica que DOGE continúa depreciándose frente a Ethereum. Este gráfico tiene una relevancia significativa dentro del ecosistema Ethereum y la creciente presión de venta podría crear oportunidades de compra para DOGE.
Support Levels:
Niveles de soporte:
- 0.00004492 / 0.00004408
- 0.00004335
A four-hour bar closing below the 0.00004492 level, which also acted as support on April 14, will lead to a further decline in DOGE's value against Ethereum.
0.00004492 / 0.000044080.00004335Una barra de cuatro horas que cierra por debajo del nivel 0.00004492, que también actuó como soporte el 14 de abril, provocará una nueva caída del valor de DOGE frente a Ethereum.
Resistance Levels:
Niveles de resistencia:
- 0.00004568 / 0.00004658
- 0.00004734
A four-hour bar closing above the 0.00004568 level, which coincides with the EMA 9, could hinder DOGE's appreciation against Ethereum.
0.00004568 / 0.000046580.00004734Una barra de cuatro horas que cierra por encima del nivel 0.00004568, que coincide con la EMA 9, podría obstaculizar la apreciación de DOGE frente a Ethereum.

Source: COINTURK NEWS: Exploring Dogecoin's Market Trends and Technical Analysis
Fuente: COINTURK NEWS: Explorando las tendencias del mercado y el análisis técnico de Dogecoin


 Optimisus
 DogeHome
 TheNewsCrypto
 Times Tabloid
 DogeHome
 CFN
CFN Crypto Daily™
 DogeHome
 Crypto Daily™


