The S&P 500 Index (SPX) and the Nasdaq Composite made a new all-time high last week, indicating a risk-on sentiment among investors. Bitcoin (BTC) also does not want to be left behind and is currently less than $2,000 shy of the lifetime high of $69,000 made in November 2021.
El índice S&P 500 (SPX) y el Nasdaq Composite alcanzaron un nuevo máximo histórico la semana pasada, lo que indica un sentimiento de riesgo entre los inversores. Bitcoin (BTC) tampoco quiere quedarse atrás y actualmente está a menos de 2.000 dólares del máximo histórico de 69.000 dólares alcanzado en noviembre de 2021.
The momentum favors the buyers to catapult Bitcoin’s price to a new all-time high over the next few days. But the central question is, will a rise above $69,000 start the next leg of the uptrend or will the price turn down sharply and start a corrective phase, trapping the aggressive bulls?
El impulso favorece a los compradores para catapultar el precio de Bitcoin a un nuevo máximo histórico en los próximos días. Pero la pregunta central es: ¿una subida por encima de 69.000 dólares iniciará el siguiente tramo de la tendencia alcista o el precio bajará bruscamente e iniciará una fase correctiva, atrapando a los alcistas agresivos?
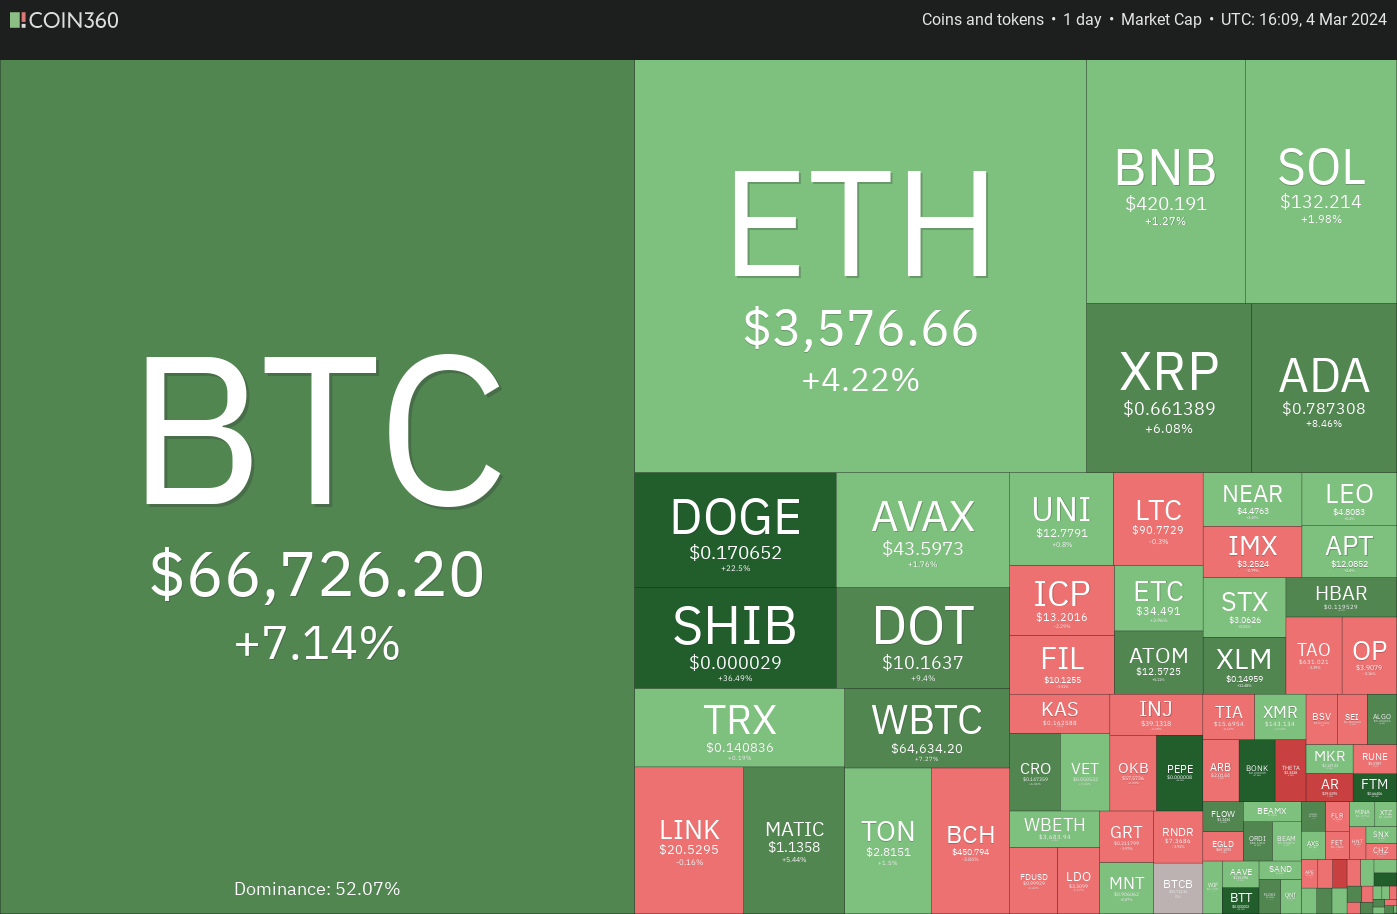
During a FOMO phase, strong returns are made within a short span of time. Even though the risk is high, the period rewards traders who can ride this phase. However, traders need to be careful because vertical rallies are followed by sharp declines. Hence, traders should keep their stops ready lest their gains may evaporate quickly.
Durante una fase FOMO, se obtienen fuertes retornos en un corto período de tiempo. Aunque el riesgo es alto, el período recompensa a los operadores que pueden aprovechar esta fase. Sin embargo, los operadores deben tener cuidado porque los repuntes verticales van seguidos de fuertes caídas. Por lo tanto, los operadores deben mantener sus paradas preparadas para que sus ganancias no se evaporen rápidamente.
Could the bulls propel Bitcoin to a new all-time high and maintain it, or is it time to book profits? Let’s analyze the charts to find out.
¿Podrían los alcistas impulsar a Bitcoin a un nuevo máximo histórico y mantenerlo, o es hora de registrar ganancias? Analicemos los gráficos para averiguarlo.
S&P 500 Index price analysis
Análisis de precios del índice S&P 500
The S&P 500 Index closed at a new all-time high on March 1, indicating that the bulls firmly remain in the driver’s seat.
El índice S&P 500 cerró en un nuevo máximo histórico el 1 de marzo, lo que indica que los alcistas siguen firmemente al mando.
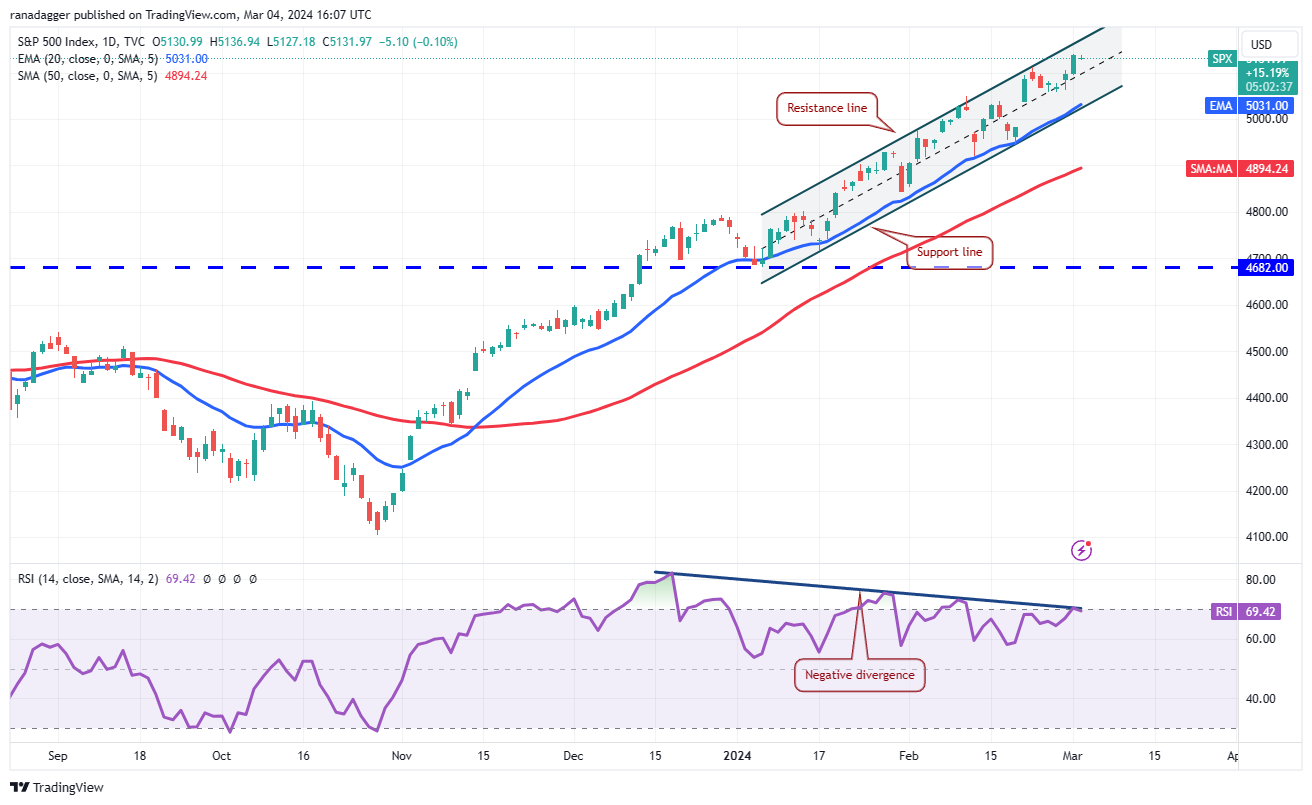
The index has been trading inside the ascending channel pattern for many days, indicating that the bears may pose a strong challenge at the resistance line. If the price turns down from the resistance line, the bears will try to pull the index to the support line. A break below the channel will start a short-term corrective phase.
El índice ha estado cotizando dentro del patrón de canal ascendente durante muchos días, lo que indica que los bajistas pueden representar un fuerte desafío en la línea de resistencia. Si el precio baja desde la línea de resistencia, los bajistas intentarán llevar el índice a la línea de soporte. Una ruptura por debajo del canal iniciará una fase correctiva a corto plazo.
On the contrary, if bulls catapult the price above the channel, it will signal a pickup in momentum. That could start a vertical rally, which may take the index to 5,300 and then to 5,500. Traders need to be cautious as the negative divergence on the relative strength index (RSI) suggests the bulls may be losing steam.
Por el contrario, si los alcistas catapultan el precio por encima del canal, indicará un repunte del impulso. Eso podría iniciar un repunte vertical, que podría llevar el índice a 5.300 y luego a 5.500. Los operadores deben ser cautelosos ya que la divergencia negativa en el índice de fuerza relativa (RSI) sugiere que los alcistas pueden estar perdiendo fuerza.
U.S. dollar Index price analysis
Análisis de precios del índice del dólar estadounidense
The bulls pushed the U.S.dollar Index (DXY) above the 20-day exponential moving average (104) on Feb. 29, but could not build upon it. Sellers pulled the price back below the 20-day EMA on March 1.
Los alcistas empujaron el índice del dólar estadounidense (DXY) por encima del promedio móvil exponencial de 20 días (104) el 29 de febrero, pero no pudieron aprovecharlo. Los vendedores volvieron a bajar el precio por debajo de la EMA de 20 días el 1 de marzo.
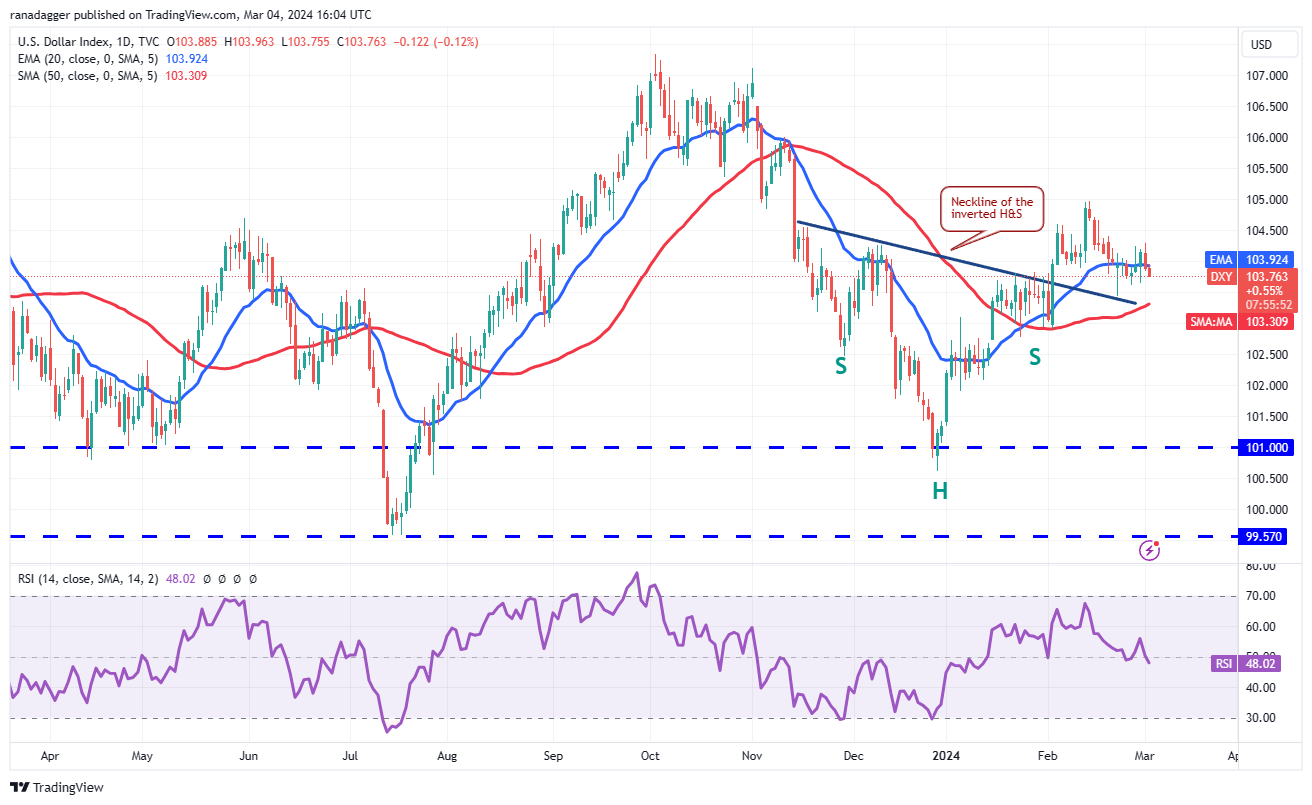
The 20-day EMA has flattened out, and the RSI is near the midpoint, indicating a possible range-bound action in the near term. If the price remains below the 20-day EMA, the index could slip to the 50-day simple moving average (103). Buyers are expected to defend this level with vigor.
La EMA de 20 días se ha estabilizado y el RSI está cerca del punto medio, lo que indica una posible acción dentro del rango en el corto plazo. Si el precio se mantiene por debajo de la EMA de 20 días, el índice podría caer hasta la media móvil simple de 50 días (103). Se espera que los compradores defiendan este nivel con vigor.
Conversely, if the price turns up from the current level and rises above 104.30, it will indicate solid buying at lower levels. The index could then rise to 105. A break above this resistance could open the doors for a potential rise to 106.
Por el contrario, si el precio sube desde el nivel actual y sube por encima de 104,30, indicará compras sólidas en niveles más bajos. El índice podría entonces subir a 105. Una ruptura por encima de esta resistencia podría abrir las puertas a una posible subida a 106.
Bitcoin price analysis
Análisis de precios de Bitcoin
Bitcoin has been in a solid uptrend for the past several days. The bears tried to halt the up move near $64,000, but that resulted in the formation of a pennant.
Bitcoin ha estado en una sólida tendencia alcista durante los últimos días. Los bajistas intentaron detener el movimiento alcista cerca de $64,000, pero eso resultó en la formación de un banderín.
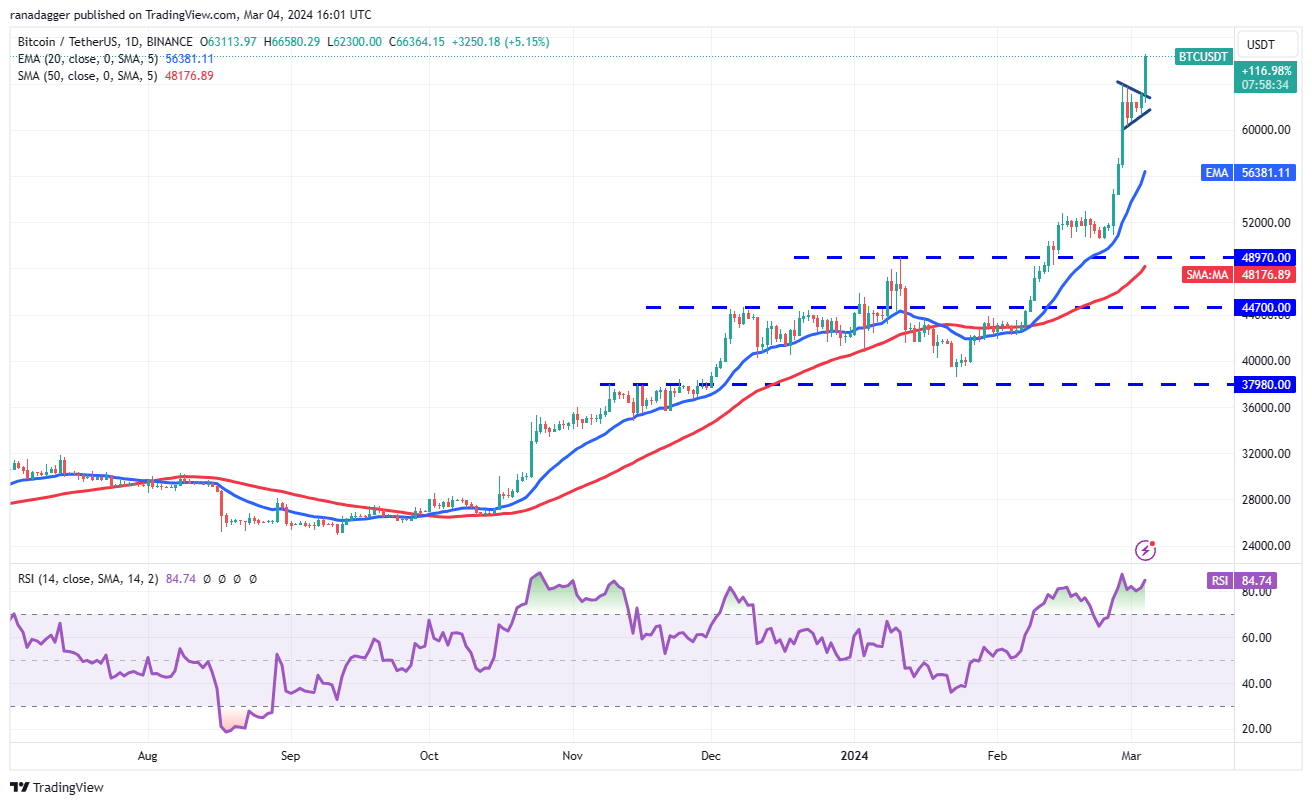
The bulls reasserted their supremacy after kicking the price above the pennant on March 4. This signals the start of the next leg of the uptrend, which could reach the all-time high at $69,000 and thereafter continue to $76,000, which is the pattern target of the breakout from the pennant.
Los alcistas reafirmaron su supremacía después de elevar el precio por encima del banderín el 4 de marzo. Esto señala el inicio del siguiente tramo de la tendencia alcista, que podría alcanzar el máximo histórico de 69.000 dólares y luego continuar hasta 76.000 dólares, que es el objetivo del patrón de la ruptura del banderín.
Time is running out for the bears. If they want to make a comeback, they will have to quickly drag the price below $60,000. If they do that, several stops of short-term traders may hit, and the BTC/USDT pair could drop to the 20-day EMA ($56,250).
A los osos se les acaba el tiempo. Si quieren regresar, tendrán que arrastrar rápidamente el precio por debajo de los 60.000 dólares. Si lo hacen, es posible que se produzcan varias paradas de los operadores a corto plazo, y el par BTC/USDT podría caer a la EMA de 20 días ($56,250).
Ether price analysis
Análisis de precios de éter
Ether (ETH) witnessed profit booking near $3,600 on Feb. 29, but the bears failed to start a pullback, indicating that every minor dip is being purchased.
Ether (ETH) fue testigo de una reserva de ganancias cercana a los $3,600 el 29 de febrero, pero los bajistas no lograron iniciar un retroceso, lo que indica que se están comprando cada caída menor.
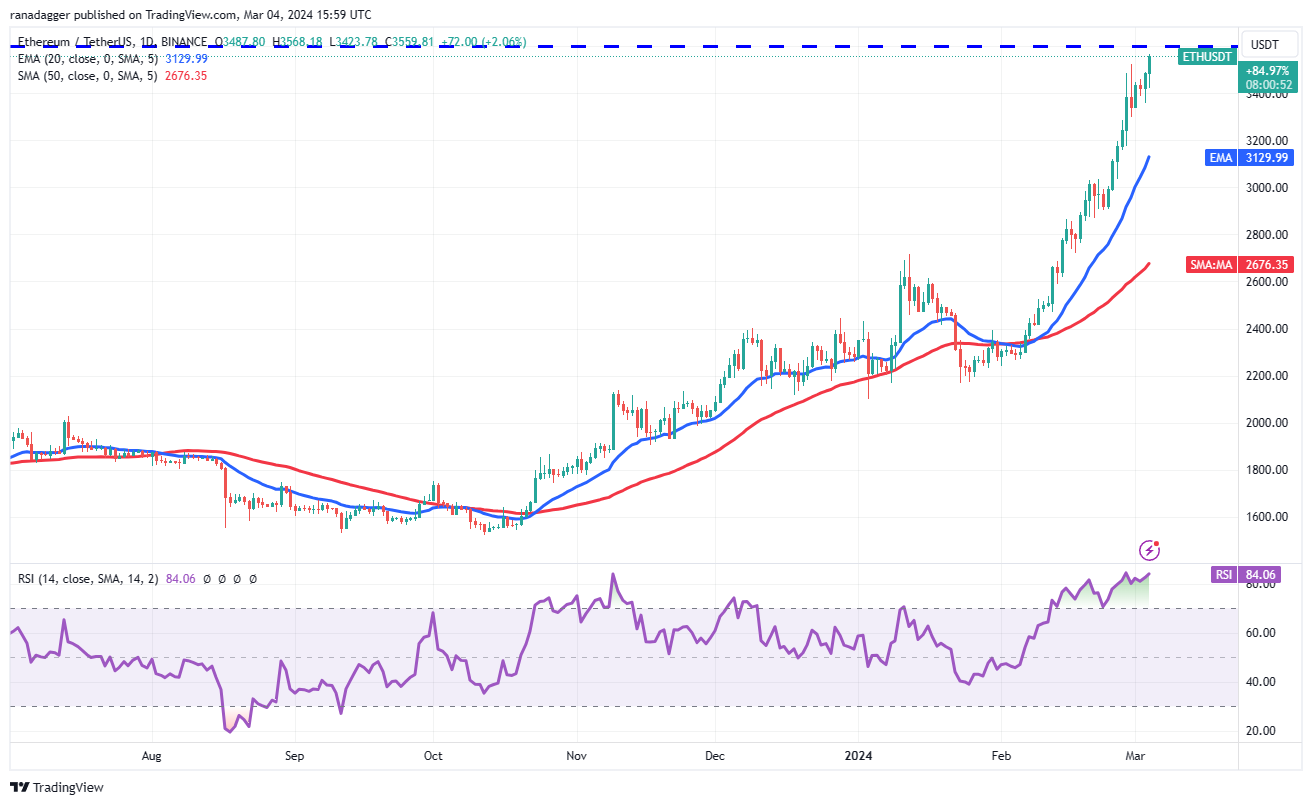
The bulls are again trying to overcome the stiff barrier at $3,600. If they manage to do that, the ETH/USDT pair could start the next leg of the uptrend and surge toward $4,000 and later to $4,150.
Los alcistas están intentando nuevamente superar la rígida barrera de los 3.600 dólares. Si logran hacer eso, el par ETH/USDT podría comenzar el siguiente tramo de la tendencia alcista y subir hacia los $4,000 y luego hasta los $4,150.
The upsloping moving averages suggest that bulls are in control, but the RSI has been in the overbought zone for several days, increasing the possibility of a short-term pullback. The immediate support on the downside is at $3,300, and then the 20-day EMA ($3,129).
Los promedios móviles ascendentes sugieren que los alcistas tienen el control, pero el RSI ha estado en la zona de sobrecompra durante varios días, lo que aumenta la posibilidad de un retroceso a corto plazo. El soporte inmediato a la baja está en 3.300$, y luego en la EMA de 20 días (3.129$).
BNB price analysis
Análisis de precios de BNB
BNB (BNB) has been in an uptrend for several days. The bears tried to stall the rally at $427, but the bulls bought the dip on Feb. 29, indicating a positive sentiment.
BNB (BNB) ha estado en tendencia alcista durante varios días. Los bajistas intentaron detener el repunte en 427 dólares, pero los alcistas compraron la caída del 29 de febrero, lo que indica un sentimiento positivo.
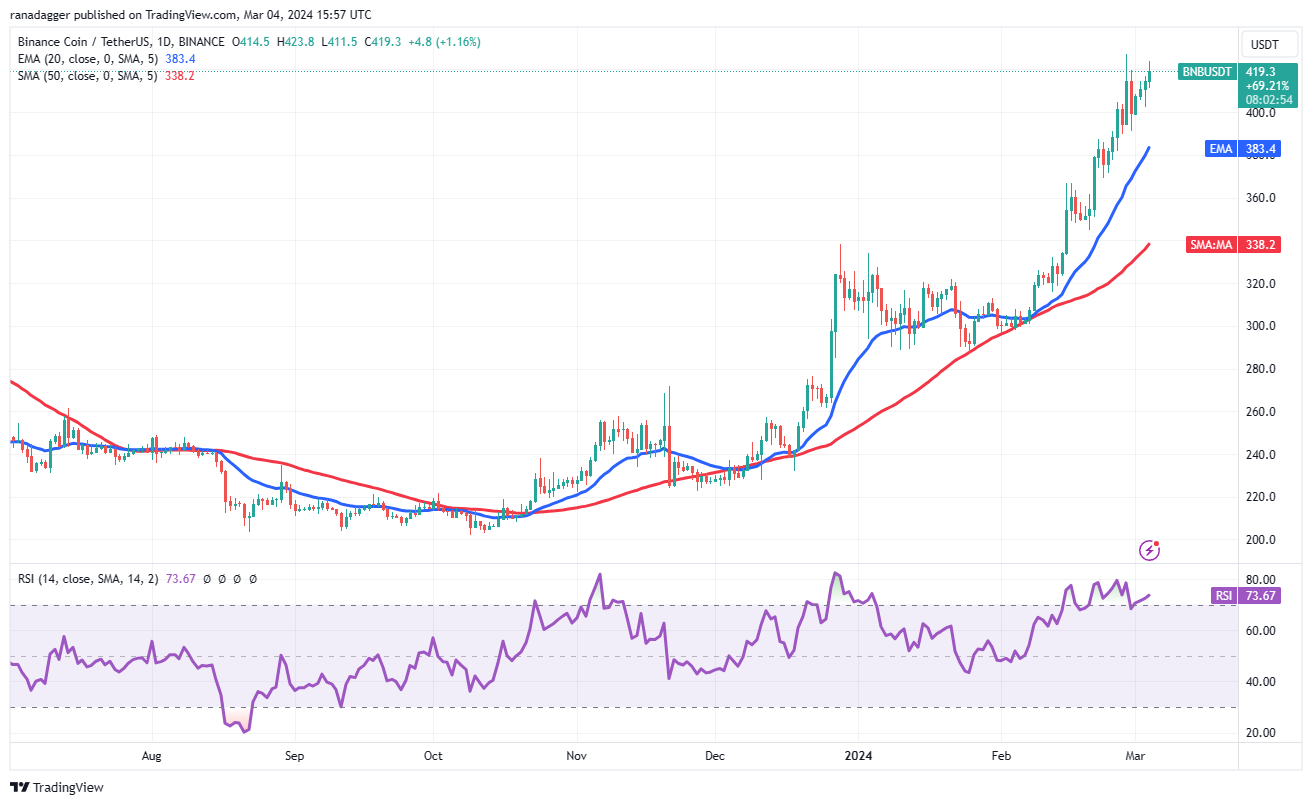
The rising moving averages and the RSI in the overbought zone suggest that the path of least resistance is to the upside. If buyers shove the price above $427, the BNB/USDT pair could reach $460. The bulls may find it challenging to break above this resistance with ease.
Las medias móviles ascendentes y el RSI en la zona de sobrecompra sugieren que el camino de menor resistencia es al alza. Si los compradores elevan el precio por encima de los USD 427, el par BNB/USDT podría alcanzar los USD 460. A los alcistas puede resultarles difícil superar esta resistencia con facilidad.
The critical support to watch on the downside is the 20-day EMA ($383). If this support cracks, it will indicate that the short-term traders may be rushing to the exit. That could start a corrective phase toward the 50-day SMA ($338).
El soporte crítico a tener en cuenta a la baja es la EMA de 20 días ($383). Si este soporte se rompe, indicará que los operadores a corto plazo pueden estar apresurándose a salir. Eso podría iniciar una fase correctiva hacia la SMA de 50 días ($338).
XRP price analysis
Análisis de precios XRP
XRP (XRP) turned down sharply on March 3, but the long tail on the candlestick shows solid buying at lower levels.
XRP (XRP) bajó bruscamente el 3 de marzo, pero la cola larga de la vela muestra compras sólidas en niveles más bajos.
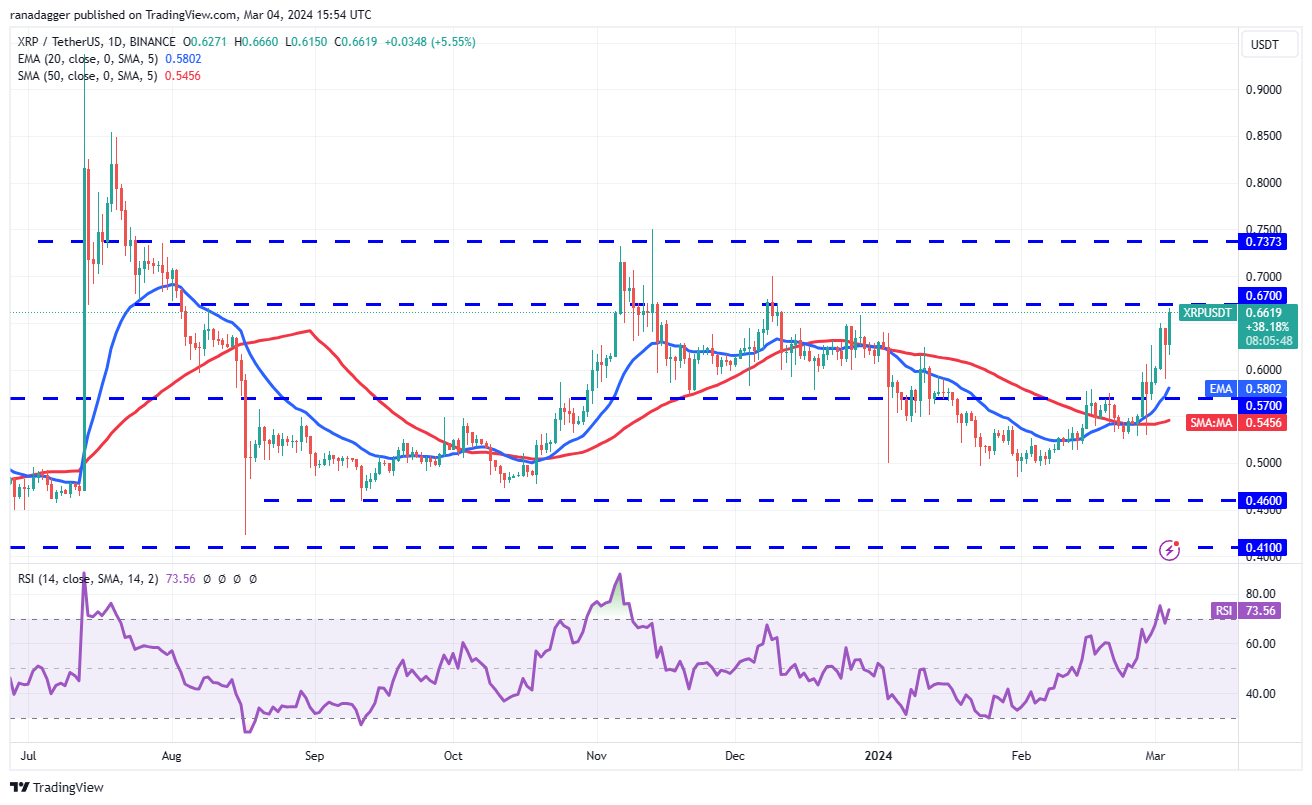
The upsloping 20-day EMA ($0.58) and the RSI in the overbought zone suggest the bulls are in command. There is a minor resistance at $0.67, but it is likely to be crossed. The rally could then reach the powerful resistance of $0.74.
La EMA de 20 días (USD 0,58) alcista y el RSI en la zona de sobrecompra sugieren que los alcistas tienen el mando. Hay una resistencia menor en 0,67 dólares, pero es probable que se supere. El repunte podría entonces alcanzar la poderosa resistencia de 0,74 dólares.
Instead, if the price turns down sharply from $0.67, it will signal that the bears are fiercely defending the level. That could pull the price down to the 20-day EMA and keep the XRP/USDT pair inside the $0.46 to $0.67 range for a while.
En cambio, si el precio cae bruscamente desde 0,67 dólares, indicará que los bajistas están defendiendo ferozmente el nivel. Eso podría hacer bajar el precio hasta la EMA de 20 días y mantener el par XRP/USDT dentro del rango de $0,46 a $0,67 por un tiempo.
Solana price analysis
Análisis de precios de Solana
Solana (SOL) closed above the $126 resistance on March 1, but the bulls are struggling to sustain the momentum. This suggests a lack of demand at higher levels.
Solana (SOL) cerró por encima de la resistencia de 126 dólares el 1 de marzo, pero los alcistas están luchando por mantener el impulso. Esto sugiere una falta de demanda en los niveles más altos.
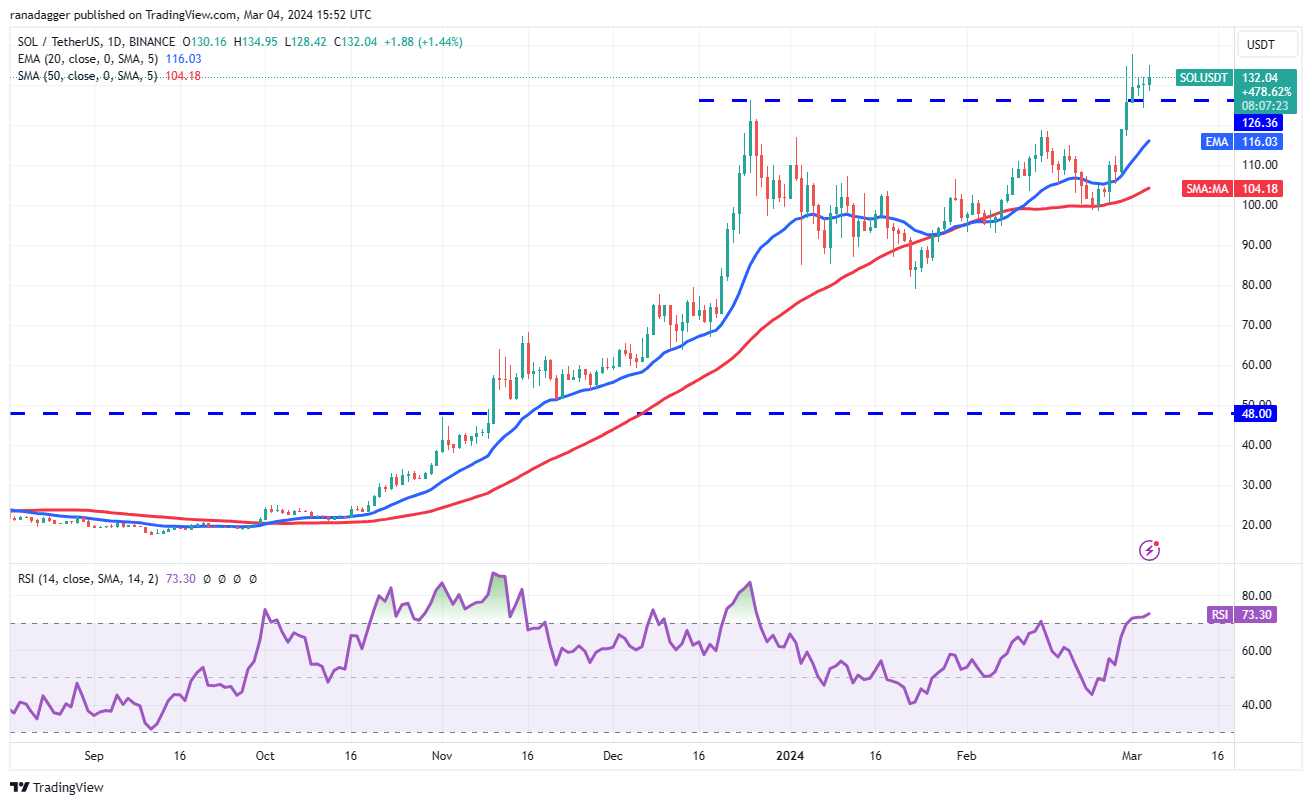
If the price maintains above $126, it will increase the likelihood of the resumption of the uptrend. If buyers pierce the $138 level, the SOL/USDT pair is likely to rise to $143 and then to $158.
Si el precio se mantiene por encima de 126 dólares, aumentará la probabilidad de que se reanude la tendencia alcista. Si los compradores superan el nivel de $138, es probable que el par SOL/USDT suba a $143 y luego a $158.
Contrary to this assumption, if the $126 level gives way, the pair may slump to the 20-day EMA ($116). The bears will have to drag the price below the 20-day EMA to suggest that the breakout above $126 was a fake move. The pair may then drop to the 50-day SMA ($104).
Contrariamente a esta suposición, si el nivel de $126 cede, el par puede caer hasta la EMA de 20 días ($116). Los bajistas tendrán que arrastrar el precio por debajo de la EMA de 20 días para sugerir que la ruptura por encima de $126 fue un movimiento falso. Luego, el par puede caer a la SMA de 50 días ($104).
Related: BTC price nears $67K as new GBTC Bitcoin outflows pass $550M
Relacionado: El precio de BTC se acerca a los $67 mil a medida que las nuevas salidas de GBTC Bitcoin superan los $550 millones
Cardano price analysis
Análisis de precios de Cardano
Cardano (ADA) started the next leg of the uptrend after buyers overcame the $0.68 barrier on March 1. The bears tried to tug the price back below the breakout level on March 3, but the bulls held their ground. This shows strong buying on dips.
Cardano (ADA) inició el siguiente tramo de la tendencia alcista después de que los compradores superaran la barrera de los 0,68 dólares el 1 de marzo. Los bajistas intentaron hacer retroceder el precio por debajo del nivel de ruptura el 3 de marzo, pero los alcistas se mantuvieron firmes. Esto muestra fuertes compras en las caídas.
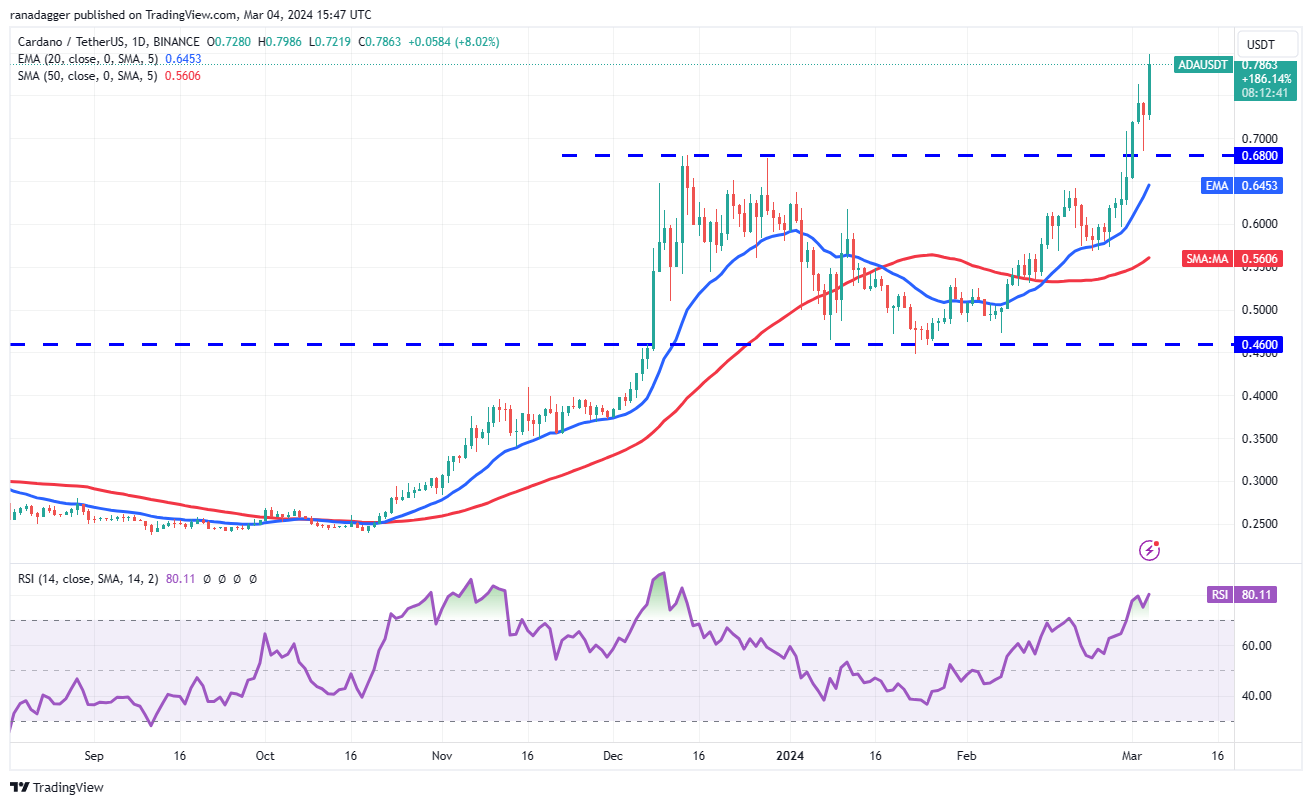
The up move is likely to reach $0.90, where the bears are expected to mount a strong defense. If the momentum remains strong and buyers bulldoze their way through $0.90, the rally could extend to $1.25. The bulls may find it difficult to cross this level.
Es probable que el movimiento alcista alcance los 0,90 dólares, donde se espera que los bajistas monten una fuerte defensa. Si el impulso se mantiene fuerte y los compradores se abren paso hasta 0,90 dólares, el repunte podría extenderse hasta 1,25 dólares. A los alcistas puede resultarles difícil cruzar este nivel.
The RSI has risen above 80, indicating that the rally is at a risk of stalling. The 20-day EMA ($0.64) remains the essential support to watch out for on the downside. A break and close below this level will signal that the bulls are losing their grip. The ADA/USDT pair may then slide to the 50-day SMA ($0.56).
El RSI ha subido por encima de 80, lo que indica que el repunte corre el riesgo de estancarse. La EMA de 20 días (USD 0,64) sigue siendo el soporte esencial al que hay que prestar atención a la baja. Una ruptura y un cierre por debajo de este nivel indicarán que los alcistas están perdiendo el control. El par ADA/USDT puede luego deslizarse hacia la SMA de 50 días ($0,56).
Dogecoin price analysis
Análisis de precios de Dogecoin
Dogecoin (DOGE) has been in a strong bull run for the past few days. The bears tried to pull the price lower on March 3, but the long tail on the candlestick shows aggressive buying by the bulls.
Dogecoin (DOGE) ha estado en una fuerte carrera alcista durante los últimos días. Los bajistas intentaron bajar el precio el 3 de marzo, pero la larga cola de la vela muestra compras agresivas por parte de los alcistas.
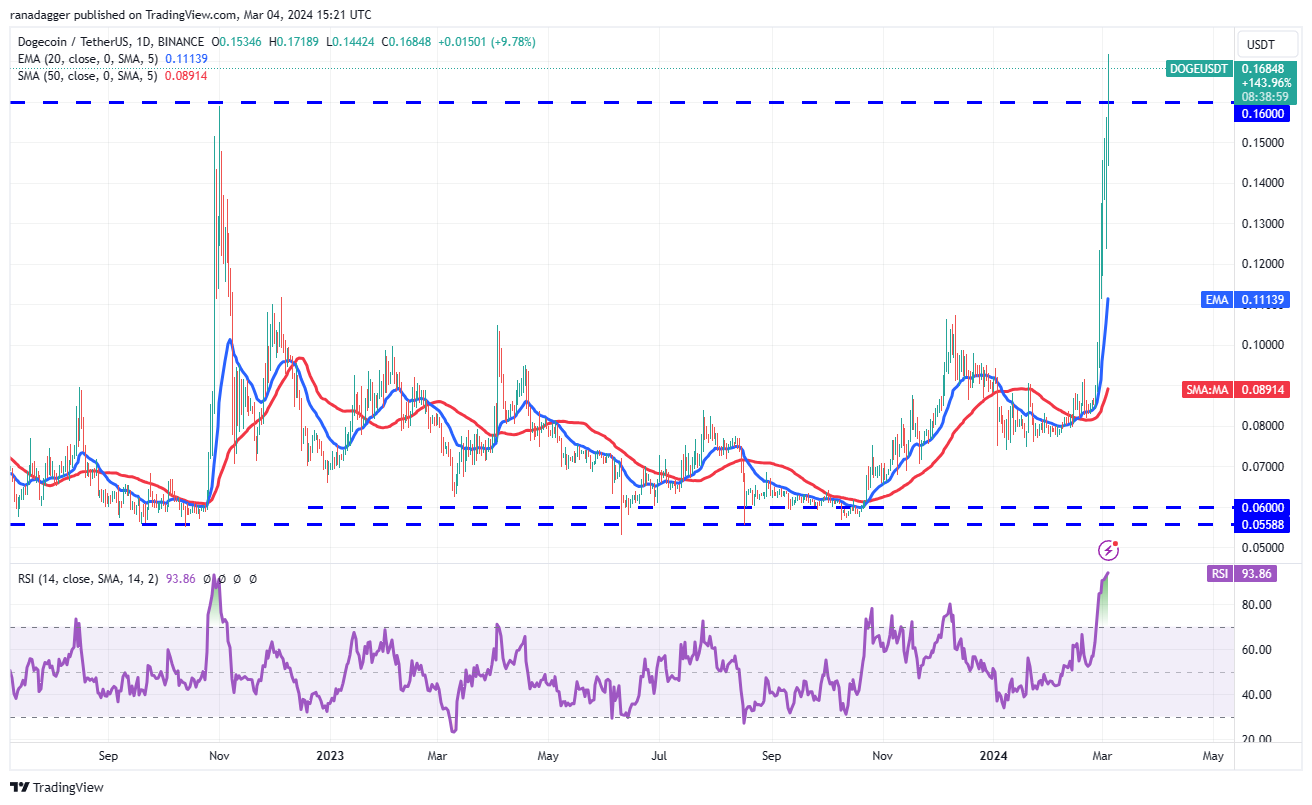
The bulls resumed the uptrend by pushing the DOGE/USDT pair above the $0.16 overhead resistance on March 4. This opens the door for a possible rise to $0.18 and thereafter to $0.22. The sharp rally has sent the RSI deep into the overbought territory, suggesting a consolidation or correction may be around the corner.
Los alcistas reanudaron la tendencia alcista empujando el par DOGE/USDT por encima de la resistencia superior de 0,16 dólares el 4 de marzo. Esto abre la puerta a un posible aumento a 0,18 dólares y posteriormente a 0,22 dólares. El fuerte repunte ha enviado al RSI profundamente hacia el territorio de sobrecompra, lo que sugiere que una consolidación o corrección puede estar a la vuelta de la esquina.
The first support on the downside is at $0.16 and then at $0.12. If this support is taken out, it will suggest that the uptrend may be over.
El primer soporte a la baja está en 0,16 dólares y luego en 0,12 dólares. Si se elimina este soporte, sugerirá que la tendencia alcista puede haber terminado.
Avalanche price analysis
Análisis de precios de avalancha
Avalanche (AVAX) completed a bullish inverse head-and-shoulders pattern after the price closed above the neckline at $42 on March 1.
Avalanche (AVAX) completó un patrón alcista inverso de cabeza y hombros después de que el precio cerrara por encima del escote a 42 dólares el 1 de marzo.
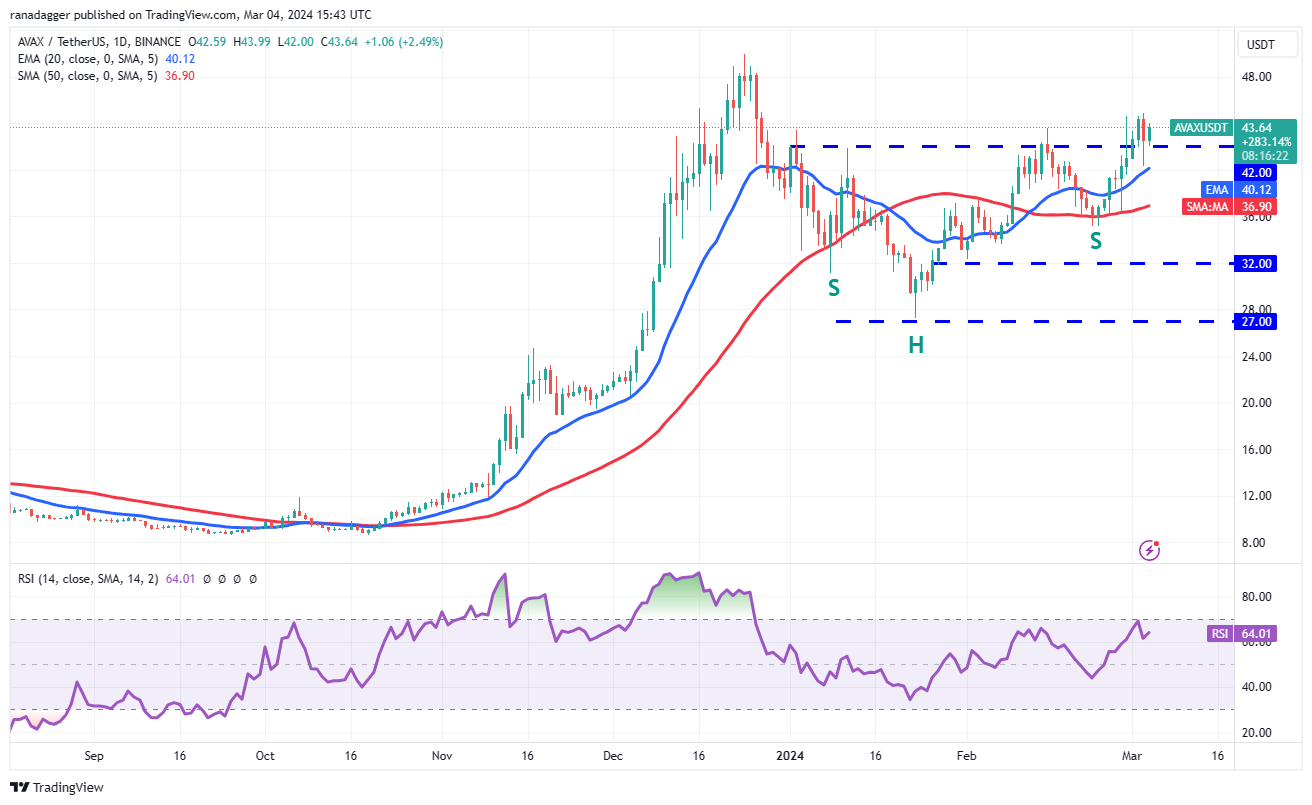
The AVAX/USDT pair is witnessing a tough battle between the bulls and the bears near the $42 level. If buyers flip the level into support and propel the price above $45, the pair could rally toward the psychological resistance at $50. If this level is overcome, the pair may reach the pattern target of $57.
El par AVAX/USDT está presenciando una dura batalla entre los alcistas y los bajistas cerca del nivel de $42. Si los compradores convierten el nivel en soporte e impulsan el precio por encima de $45, el par podría subir hacia la resistencia psicológica de $50. Si se supera este nivel, el par puede alcanzar el objetivo del patrón de 57 dólares.
Sellers will have to pull the price below the 20-day EMA ($40) to weaken the bulls. The pair could then slump to the 50-day SMA ($37), suggesting that the breakout on March 1 may have been a bull trap.
Los vendedores tendrán que bajar el precio por debajo de la EMA de 20 días ($40) para debilitar a los alcistas. Luego, el par podría caer hasta la SMA de 50 días ($37), lo que sugiere que la ruptura del 1 de marzo puede haber sido una trampa alcista.
This article does not contain investment advice or recommendations. Every investment and trading move involves risk, and readers should conduct their own research when making a decision.
Este artículo no contiene consejos ni recomendaciones de inversión. Cada movimiento de inversión y comercio implica riesgos, y los lectores deben realizar su propia investigación al tomar una decisión.


 Crypto Daily™
 CaptainAltcoin
 Thecryptoupdates
 Crypto Intelligence
 CoinsProbe
 Crypto News Land
 DogeHome
 InsideBitcoin News
 Coin Edition


