31 дек 2023 в 13:11 // Цена

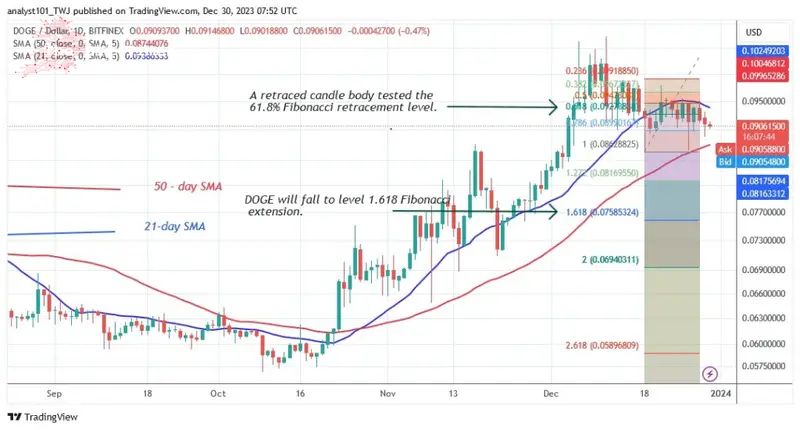
DOGE has been trapped between moving average lines over the past week. Buyers tried unsuccessfully to bring the price back above the 21-day SMA.
На прошлой неделе DOGE оказался в ловушке между линиями скользящих средних. Покупатели безуспешно пытались вернуть цену выше 21-дневной SMA.
Long-term outlook for Dogecoin price: bearish
Долгосрочный прогноз цены Dogecoin: медвежий
Dogecoin (DOGE) price is expected to decline further if it breaks below the 21-day SMA on December 19.
Ожидается, что цена Dogecoin (DOGE) продолжит снижаться, если 19 декабря она пробьется ниже 21-дневной SMA.
On Dec. 26, the bears pushed the price above the 50-day simple moving average, but the bulls bought the dips. The bears now have the upper hand and DOGE is falling. The cryptocurrency will test the support of the 50-day simple moving average. According to the price indicator, DOGE will fall to the Fibonacci extension of $1.618 or the low of $0.075.
26 декабря медведи подняли цену выше 50-дневной простой скользящей средней, но быки купили на падении. Медведи теперь одерживают верх, и DOGE падает. Криптовалюта протестирует поддержку 50-дневной простой скользящей средней. Согласно ценовому индикатору, DOGE упадет до расширения Фибоначчи 1,618 доллара или минимума 0,075 доллара.
Dogecoin indicator analysis
Анализ индикаторов Dogecoin
DOGE's price bars have gotten caught between the moving average lines. If the moving average lines are broken, DOGE will develop a trend. Selling pressure will intensify if the price of DOGE falls below the moving average lines.
Ценовые бары DOGE застряли между линиями скользящих средних. Если линии скользящих средних пробиты, DOGE разовьет тренд. Давление продавцов усилится, если цена DOGE упадет ниже линий скользящей средней.
Technical Indicators
Технические индикаторы
Key resistance levels – $0.12 and $0.14
Ключевые уровни сопротивления – $0,12 и $0,14.
Key support levels – $0.06 and $0.04
Ключевые уровни поддержки – $0,06 и $0,04.

What is the next direction for Dogecoin?
Каково следующее направление развития Dogecoin?
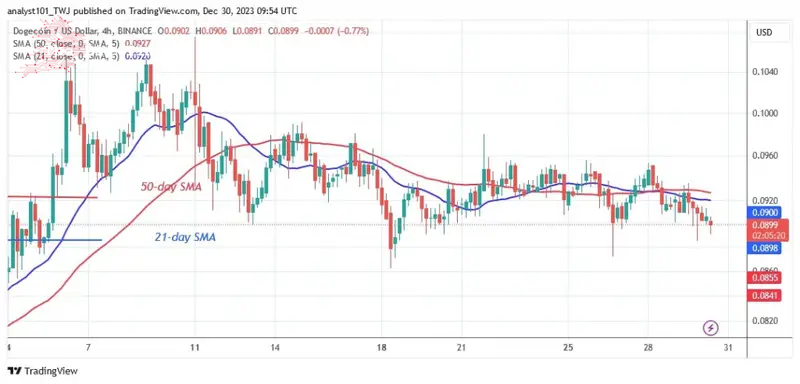
DOGE is moving sideways on the 4-hour chart. The price of the altcoin is fluctuating between $0.086 and $0.097. Doji candlesticks, which have a small body and are indecisive, have characterised the price action. Doji candlesticks are rigid and restrict the price movement.
DOGE движется в боковом направлении на 4-часовом графике. Цена альткоина колеблется между $0,086 и $0,097. Свечи Доджи, имеющие маленькое тело и нерешительные, характеризуют ценовое действие. Свечи Доджи являются жесткими и ограничивают движение цены.

Disclaimer. This Analysis and forecast are the personal opinions of the author and are not a recommendation to buy or sell cryptocurrency and should not be viewed as an endorsement by CoinIdol.com. Readers should do the research before investing in funds.
Отказ от ответственности. Этот анализ и прогноз являются личным мнением автора, не являются рекомендацией покупать или продавать криптовалюту и не должны рассматриваться CoinIdol.com как одобрение. Читателям следует провести исследование, прежде чем инвестировать в фонды.
Source: https://thebittimes.com/doge-falls-to-0-095-in-the-face-of-further-rejections-tbt75247.html
Источник: https://thebittimes.com/doge-falls-to-0-095-in-the-face-of-further-rejections-tbt75247.html.


 The Bit Journal
 Times Tabloid
 CoinoMedia
 U_Today
 ETHNews
 crypto.news
 CoinPedia News
 CoinoMedia
 Optimisus


