17 дек 2023 в 10:07 // Цена

The price of Dogecoin (DOGE) is under threat as it has failed twice at the $0.1063 resistance level. Price Analysis by Coinidol.com.
Цена Dogecoin (DOGE) находится под угрозой, поскольку она дважды провалилась на уровне сопротивления в 0,1063 доллара. Анализ цен от Coinidol.com.
Dogecoin price long-term forecast: bullish
Долгосрочный прогноз цены Dogecoin: бычий
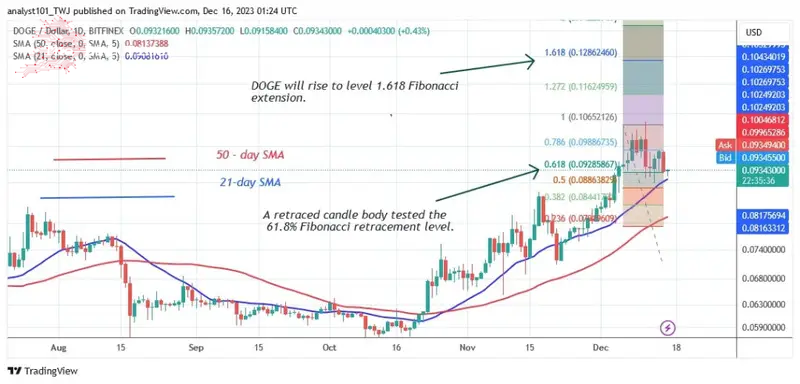
The altcoin has also fallen above the moving average lines twice. The uptrend continues to be held back by the high of $0.098. DOGE is trading at the $0.094 support at the time of writing. The cryptocurrency is steadily approaching the critical support level. Should the price fall below the $0.090 support or the 21-day simple moving average, selling pressure on DOGE will increase again. The initial decline will be above the 50-day simple moving average (SMA) or the low at $0.080.
Альткоин также дважды падал выше линий скользящей средней. Восходящий тренд по-прежнему сдерживается максимумом в $0,098. На момент написания DOGE торгуется на уровне поддержки в $0,094. Криптовалюта уверенно приближается к критическому уровню поддержки. Если цена упадет ниже поддержки $0,090 или 21-дневной простой скользящей средней, давление продавцов на DOGE снова усилится. Первоначальное снижение будет выше 50-дневной простой скользящей средней (SMA) или минимума на уровне 0,080 доллара.
Dogecoin indicator reading
Показания индикатора Dogecoin
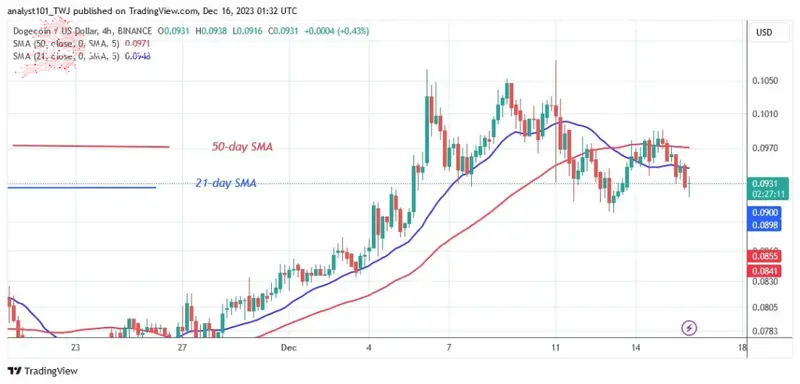
DOGE's price bounces twice above the 21-day SMA support as the bears retest the moving average lines. The recent downturn has forced the altcoin's price bars to fall below the moving average lines on the 4-hour chart. DOGE is in an uptrend as long as the price bars are above the descending moving average lines.
Цена DOGE дважды подскочила выше поддержки 21-дневной SMA, поскольку медведи повторно тестируют линии скользящей средней. Недавний спад вынудил ценовые бары альткоина упасть ниже линий скользящей средней на 4-часовом графике. DOGE находится в восходящем тренде, пока ценовые бары находятся выше линий нисходящей скользящей средней.
Technical indicators
Технические индикаторы
Key resistance levels – $0.12 and $0.14
Ключевые уровни сопротивления – $0,12 и $0,14.
Key support levels – $0.06 and $0.04
Ключевые уровни поддержки – $0,06 и $0,04.

What is the next direction for Dogecoin?
Каково следующее направление развития Dogecoin?
DOGE is trading between $0.090 and $0.1050 on the 4-hour chart. The rally has come to an end at the recent high. Buyers were not able to sustain the positive momentum above the recent high. The recent high is a historical price level from April 3rd.
DOGE торгуется между $0,090 и $0,1050 на 4-часовом графике. Ралли завершилось на недавнем максимуме. Покупатели не смогли сохранить положительную динамику выше недавнего максимума. Недавний максимум — это исторический уровень цен от 3 апреля.
As reported by Coinidol.com last week, the uptrend was broken on December 6 after reaching a high of $0.1063. DOGE has pulled back above the 21-day simple moving average and resumed its uptrend.
Как сообщил Coinidol.com на прошлой неделе, восходящий тренд был сломан 6 декабря после достижения максимума в $0,1063. DOGE откатился выше 21-дневной простой скользящей средней и возобновил восходящий тренд.

Disclaimer. This Analysis and forecast are the personal opinions of the author and are not a recommendation to buy or sell cryptocurrency and should not be viewed as an endorsement by CoinIdol.com. Readers should do their research before investing in funds.
Отказ от ответственности. Этот анализ и прогноз являются личным мнением автора, не являются рекомендацией покупать или продавать криптовалюту и не должны рассматриваться CoinIdol.com как одобрение. Читателям следует провести исследование, прежде чем инвестировать в фонды.
Source: https://thebittimes.com/doge-price-bounces-twice-above-0-090-and-resumes-its-ascent-tbt73960.html
Источник: https://thebittimes.com/doge-price-bounces-twice-above-0-090-and-resumes-its-ascent-tbt73960.html.


 Thecryptoupdates
 The Bit Journal
 Times Tabloid
 CoinoMedia
 U_Today
 ETHNews
 crypto.news
 CoinPedia News
 CoinoMedia


