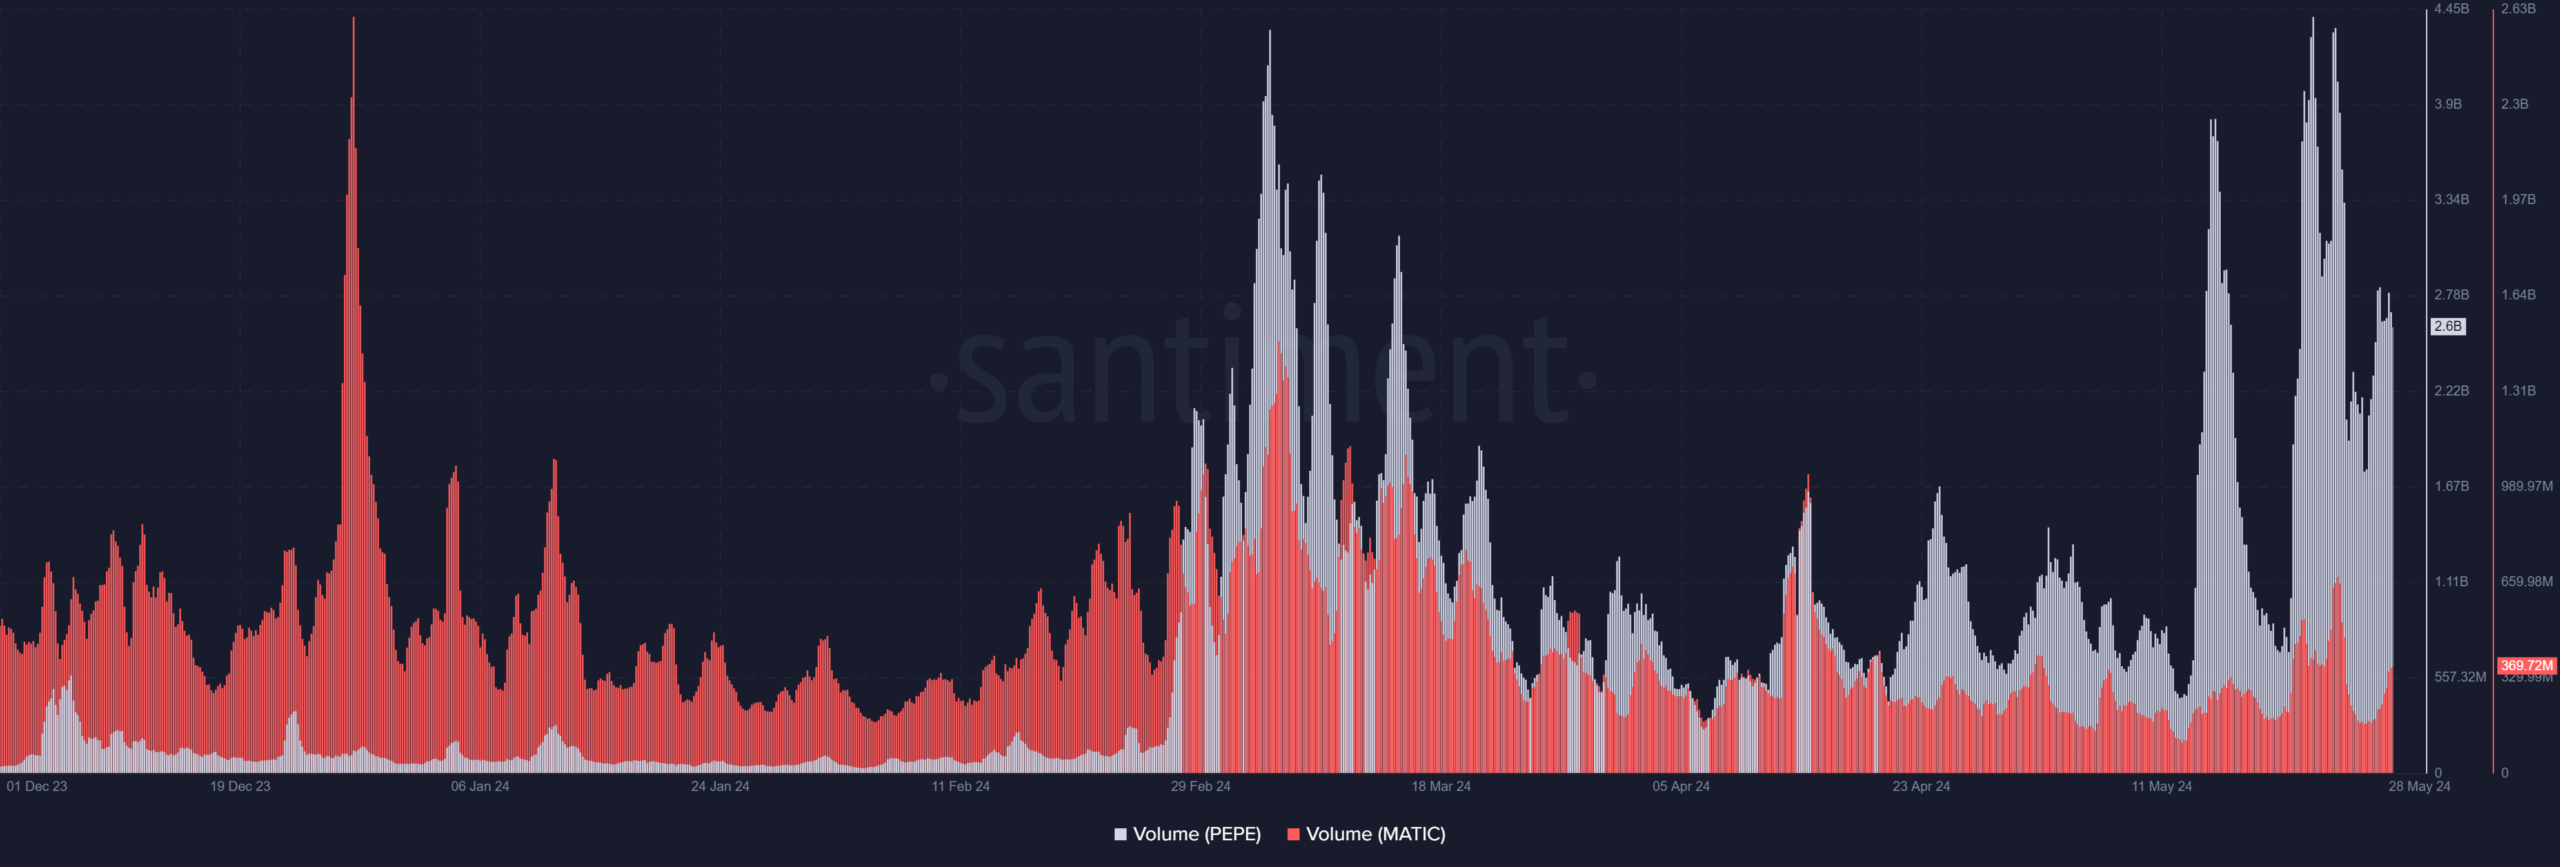
, @media only screen and (min-width: 0px) and (min-height: 0px) { div[id^="bsa-zone_1708432009695-0_123456"] { min-width: 320px; min-height: 50px; } } @media only screen and (min-width: 640px) and (min-height: 0px) { div[id^="bsa-zone_1708432009695-0_123456"] { min-width: 728px; min-height: 90px; } } Pepe has made significant strides towards Polygon in terms of market capitalization. The memecoin has also surpassed MATIC in volume. Bitcoin [BTC] and Ethereum [ETH] have firmly established themselves as the top two cryptocurrencies by market cap. However, the competition has intensified among the remaining top 100 cryptocurrencies. Pepe [PEPE] and Polygon [MATIC] are currently engaged in a tight race for the 18th and 19th positions in the market cap ranking. Pepe’s recent surge in price and volume has made it increasingly challenging for MATIC to maintain its position. @media only screen and (min-width: 0px) and (min-height: 0px) { div[id^="bsa-zone_1708432127066-0_123456"] { min-width: 320px; min-height: 50px; } } @media only screen and (min-width: 640px) and (min-height: 0px) { div[id^="bsa-zone_1708432127066-0_123456"] { min-width: 728px; min-height: 90px; } } Pepe inches closer to overtaking Polygon According to data from CoinMarketCap, the 18th and 19th spots on the market capitalization ranking have been hotly contested. Polygon currently holds the 18th position with a market cap exceeding $7.2 billion. However, this position is now under threat from Pepe, which has experienced significant price gains recently. Analysis of Pepe’s market capitalization reveals an increase to over $6.8 billion from approximately $4.6 billion in the past seven days alone. This substantial surge has brought Pepe closer to overtaking MATIC; further increases could lead to a change in ranking. Pepe exhibits higher activity than Polygon Analysis of volume trends on Santiment indicated that Pepe has been experiencing a significant surge. Over the past seven days, the volume chart for Pepe has consistently shown daily volumes surpassing $2 billion, with some instances nearly reaching the $4 billion mark. Currently, the volume stands at over $2.6 billion. Source: Santiment In contrast, the volume chart for MATIC revealed that it has only exceeded the $1 billion threshold once in close to two months, with a current volume of around $369 million. This suggests that Pepe was experiencing higher trading activity than MATIC at press time. Comparison of price trends Analysis of Pepe’s price trend on a daily timeframe revealed that in the last seven days, it has achieved four different all-time highs. The most recent was on 27th May, with a price increase of 4.21%, reaching approximately $0.0000167. However, as of this writing, it was trading at around $0.0000164, reflecting a decline of approximately 1.5%. Despite this decline, Pepe remained in a strong bull trend, with its Relative Strength Index (RSI) indicating oversold conditions. Source: TradingView On the other hand, analysis of Polygon’s trend showed that it also experienced an uptrend on 27th May, with a price increase of 3.94%, reaching around $0.74. 
 Source: TradingView Is your portfolio green? Check out the Pepe Profit Calculator However, its overall price trend has been less impressive than Pepe’s. As of this writing, Polygon was trading at around $0.73, following a decline of over 1%. Take a Survey: Chance to Win $500 USDT @media only screen and (min-width: 0px) and (min-height: 0px) { div[id^="bsa-zone_1708432161540-0_123456"] { min-width: 320px; min-height: 50px; } } @media only screen and (min-width: 640px) and (min-height: 0px) { div[id^="bsa-zone_1708432161540-0_123456"] { min-width: 728px; min-height: 90px; } } Next: Mog Coin price prediction stays bullish post-300% surge – What next? Share Share Tweet
, только экран @media и (минимальная ширина: 0 пикселей) и (минимальная высота: 0 пикселей) { div[id^="bsa-zone_1708432009695-0_123456"] { min-width: 320 пикселей; минимальная высота: 50 пикселей; } } @media only screen and (min-width: 640px) и (min-height: 0px) { div[id^="bsa-zone_1708432009695-0_123456"] { min-width: 728px; минимальная высота: 90 пикселей; } } Пепе добился значительных успехов в отношении Polygon с точки зрения рыночной капитализации. Мемкойн также превзошел MATIC по объему. Биткойн [BTC] и Эфириум [ETH] прочно зарекомендовали себя как две лучшие криптовалюты по рыночной капитализации. Однако конкуренция среди оставшихся топ-100 криптовалют усилилась. Pepe [PEPE] и Polygon [MATIC] в настоящее время ведут напряженную борьбу за 18-е и 19-е места в рейтинге рыночной капитализации. Недавний рост цен и объемов продаж Пепе сделал MATIC все более сложной задачей для сохранения своих позиций. @media only screen and (min-width: 0px) и (min-height: 0px) { div[id^="bsa-zone_1708432127066-0_123456"] { min-width: 320px; минимальная высота: 50 пикселей; } } @media only screen and (min-width: 640px) и (min-height: 0px) { div[id^="bsa-zone_1708432127066-0_123456"] { min-width: 728px; минимальная высота: 90 пикселей; } } Пепе на несколько шагов приблизился к тому, чтобы обогнать Polygon. Согласно данным CoinMarketCap, 18-е и 19-е места в рейтинге рыночной капитализации являются предметом ожесточенных споров. Polygon в настоящее время занимает 18-е место с рыночной капитализацией, превышающей 7,2 миллиарда долларов. Однако сейчас эта позиция находится под угрозой со стороны компании Pepe, которая в последнее время значительно выросла в ценах. Анализ рыночной капитализации Пепе показывает увеличение до более чем 6,8 миллиардов долларов с примерно 4,6 миллиардов долларов только за последние семь дней. Этот существенный скачок приблизил Пепе к тому, чтобы обогнать MATIC; Дальнейшее увеличение может привести к изменению рейтинга. Пепе демонстрирует более высокую активность, чем Polygon. Анализ тенденций объемов на Santiment показал, что Пепе переживает значительный всплеск. За последние семь дней график объемов продаж Пепе постоянно показывал ежедневные объемы, превышающие 2 миллиарда долларов, а в некоторых случаях почти достигающие отметки в 4 миллиарда долларов. На данный момент объем составляет более 2,6 миллиарда долларов. Источник: Santiment Напротив, график объемов MATIC показал, что он превысил порог в 1 миллиард долларов только один раз за почти два месяца, при текущем объеме около 369 миллионов долларов. Это говорит о том, что на момент публикации у Пепе была более высокая торговая активность, чем у MATIC. Сравнение ценовых тенденций. Анализ ценовой тенденции Пепе на дневном графике показал, что за последние семь дней она достигла четырех разных рекордных максимумов. Последний раз произошел 27 мая, когда цена выросла на 4,21% и достигла примерно 0,0000167 долларов США. Однако на момент написания этой статьи он торговался на уровне около $0,0000164, что отражает снижение примерно на 1,5%. Несмотря на это снижение, Пепе оставался в сильном бычьем тренде, а индекс относительной силы (RSI) указывает на условия перепроданности. Источник: TradingView. С другой стороны, анализ тренда Polygon показал, что 27 мая он также испытал восходящий тренд, при этом цена выросла на 3,94% и достигла около 0,74 доллара. Источник: TradingView Является ли ваш портфель зеленым? Ознакомьтесь с калькулятором прибыли Пепе. Однако общая тенденция его цен была менее впечатляющей, чем у Пепе. На момент написания этой статьи Polygon торговался на уровне около $0,73 после снижения более чем на 1%. Пройдите опрос: шанс выиграть 500 долларов США @media only screen and (min-width: 0px) and (min-height: 0px) { div[id^="bsa-zone_1708432161540-0_123456"] { min-width: 320px; минимальная высота: 50 пикселей; } } @media only screen and (min-width: 640px) и (min-height: 0px) { div[id^="bsa-zone_1708432161540-0_123456"] { min-width: 728px; минимальная высота: 90 пикселей; } } Далее: прогноз цены Mog Coin остается оптимистичным после скачка на 300% – что дальше? Поделиться Поделиться Твитнуть


 Thecryptoupdates
 The Bit Journal
 Times Tabloid
 CoinoMedia
 U_Today
 ETHNews
 crypto.news
 CoinPedia News
 CoinoMedia


