Following an impressive debut with substantial listing gains, the BOME price analysis delves into its significant 75% surge.
After stabilizing around $0.00800000, #Book of Meme embarked on a consistent upward trajectory. However, it encountered several rejections near the 38.20% Fibonacci Level.
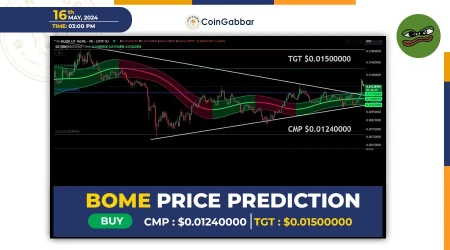
Despite consolidating for over a month, today saw a significant surge in BOME's price as it broke above a notable symmetrical triangle pattern.
On the hourly chart, $BOME has been trading within the confines of a Bullish Flag Pattern.
The Gaussian channel continues to signal bullish momentum, further supported by the breakout from the symmetrical triangle pattern.
Sustaining above this pattern could trigger a rally, with the next resistance level lying at $0.01500000, which coincides with the 50% Fibonacci Level.
According to Coingabbar analysis, conversely, failure to maintain support at the trendline might result in increased selling pressure, potentially driving the price down towards $0.01000000.
KEY LEVELS:
RESISTANCE LEVEL: $0.01500000-$0.02000000
SUPPORT LEVEL: $0.01000000-$0.00800000
Disclaimer: Coingabbar's guidance and chart analysis on cryptocurrencies, NFTs, or any other decentralized investments are for informational purposes only. None of it is financial advice. Users are strongly advised to conduct their research, exercise judgment, and be aware of the inherent risks associated with any financial instruments. Coingabbar is not liable for any financial losses. Cryptocurrency and NFT markets could be highly volatile; users should consult financial professionals and assess their risk tolerance before investing.


 DogeHome
 BlockchainReporter
 CoinPedia News
 TheNewsCrypto
 CFN
CFN Optimisus
 Crypto News Land


