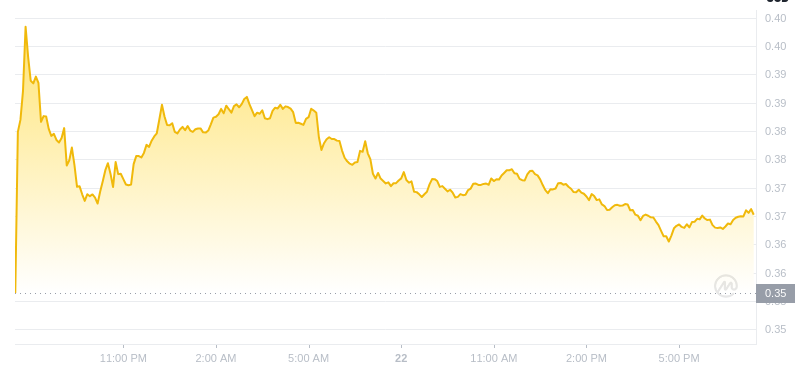
- 1 DOGE price is hovering around its meaningful support zone around $0.1500.
- 2 Technical indicators are suggesting a notable rebound ahead.
DOGE price is near the 50 day EMA support mark and is looking for a pullback. Buyers are decisively holding the gains. Despite the sharp selloff across the crypto market, the memecoin price did not lose many gains and held on above the neutral trajectory.
At press time, the Dogecoin (DOGE) price traded at $0.155 with an intraday
gain of 1.58%, reflecting neutrality on the charts. It has a monthly return ratio of 1.11% and 70.90% on a yearly basis. DOGE/BTC is at 0.00000247 BTC, and the market cap stood at $22.41 Billion. Analysts are neutral and suggest that Dogecoin may replicate a pullback and will retain the upside zone of $0.200 soon.
DOGE Price Volume Profile On Daily Charts
The above chart shows the price to volume data of the DOGE crypto showcases profit booking in the last few sessions. Moreover, the price action replicates that, sellers are aggressively attempting to push DOGE below its key EMAs, but the bulls are holding their grip tightly and secured gains above the 50 day EMA mark. The intraday trading volume dropped over 43.88% to $2.02 Billion.
Price Volatility & Weighted Sentiment Outlook
The price volatility curve depicts a neutral indication with a 29.90% decline to 0.016. However, the weighted sentiment data signifies a negative outlook, the curve stayed below the midline around -0.698.
Social Dominance And X Followers Overview
The social dominance data noted significant investor interest and spiked over 11.89 to 1.963%%. Conversely, X followers’ data reflected a sharp decline and decreased over 564.28% to -6605.
Development Activity and Total Open Interest Insights
The development data witnessed a steep decline and decreased over 76.27% to 3.02 this week. However, the derivative data signifies long buildup, the open interest jump of over 3.89% to $11.90 Billion this week.
Per the Fib levels, the Dogecoin price has held gains above the 38.2% zone and is trading above the mid bollinger band support zone. However, the RSI curve stayed in the oversold region, and a negative crossover was noted on the charts.
The total supply of the Dogecoin is 143.81 Billion, whereas the volume-to-market cap ratio is 0.0901, and it is ranked 9 in terms of market cap in the global crypto market.
Summary
The Dogecoin price trades above the midline zone and depicts indecisiveness among the bull and bear army. The price action showcases consolidation movement throughout the week, and bulls are looking for a rebound.
Technical Levels
Support Levels: $0.1470 and $0.1310
Resistance Levels: $0.1680 and $0.1800
Disclaimer
The views and opinions stated by the author or any other person named in this article are for informational purposes only and do not constitute financial, investment, or other advice.


 Optimisus
 Crypto Intelligence
 BlockchainReporter
 Cryptopolitan_News
 DogeHome
 Crypto Intelligence
 Bitcoin Sistemi EN
 CoinsProbe
 CryptoPotato_News


