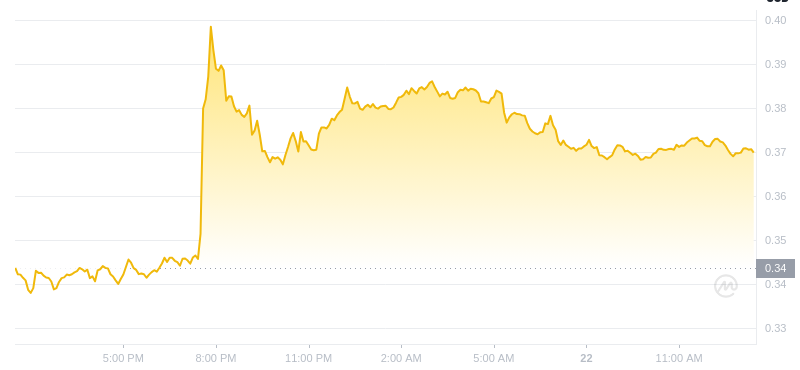
Dogecoin's Bullish Breakout: Historical Patterns Suggest New Market Surge
Dogecoin (DOGE) has historically exhibited recurring price patterns that indicate significant future bull runs. After reaching market peaks, DOGE typically consolidates within a descending triangle before initiating a new bullish trend.
Historical Examples
- January 2014: DOGE surged by 207.35% after breaking out of a descending triangle.
- November 2020: A breakout led to a 441.96% rally, followed by a 12,197% surge.
- January 2024: DOGE experienced a 207.85% price increase after breaking out of a descending triangle.
Recent Breakout
In May 2021, DOGE reached an all-time high of $0.73905 and subsequently entered a bear market. In January 2024, it broke out of a descending triangle pattern, resulting in a 207.85% price increase. This suggests the onset of a new bull market.
Strategic Analysis and Patience
The recurring nature of descending triangle breakouts in DOGE's history highlights the importance of strategic analysis and patience for investors. While past performance does not guarantee future outcomes, these patterns indicate a promising outlook for DOGE.
Additional Reading:
- Shiba Inu Breaks Out of Descending Triangle, Signalling Potential Bullish Run
- XRP Makes 30% Weekly Surge as Other Leading Coins Consolidate
- XRP: Analyst Predicts $0.70 Amidst Pattern Speculation
- Solana Price Prediction 2024: Is It Time for This SOL Alternative to Shine?
- Polygon Primed for a Major Rally After Triangle Breakout


 ItsBitcoinWorld
 Cryptopolitan_News
 U_Today
 Cryptopolitan_News
 DT News
 Cryptopolitan_News
 Thecryptoupdates
 DogeHome
 Coincu


