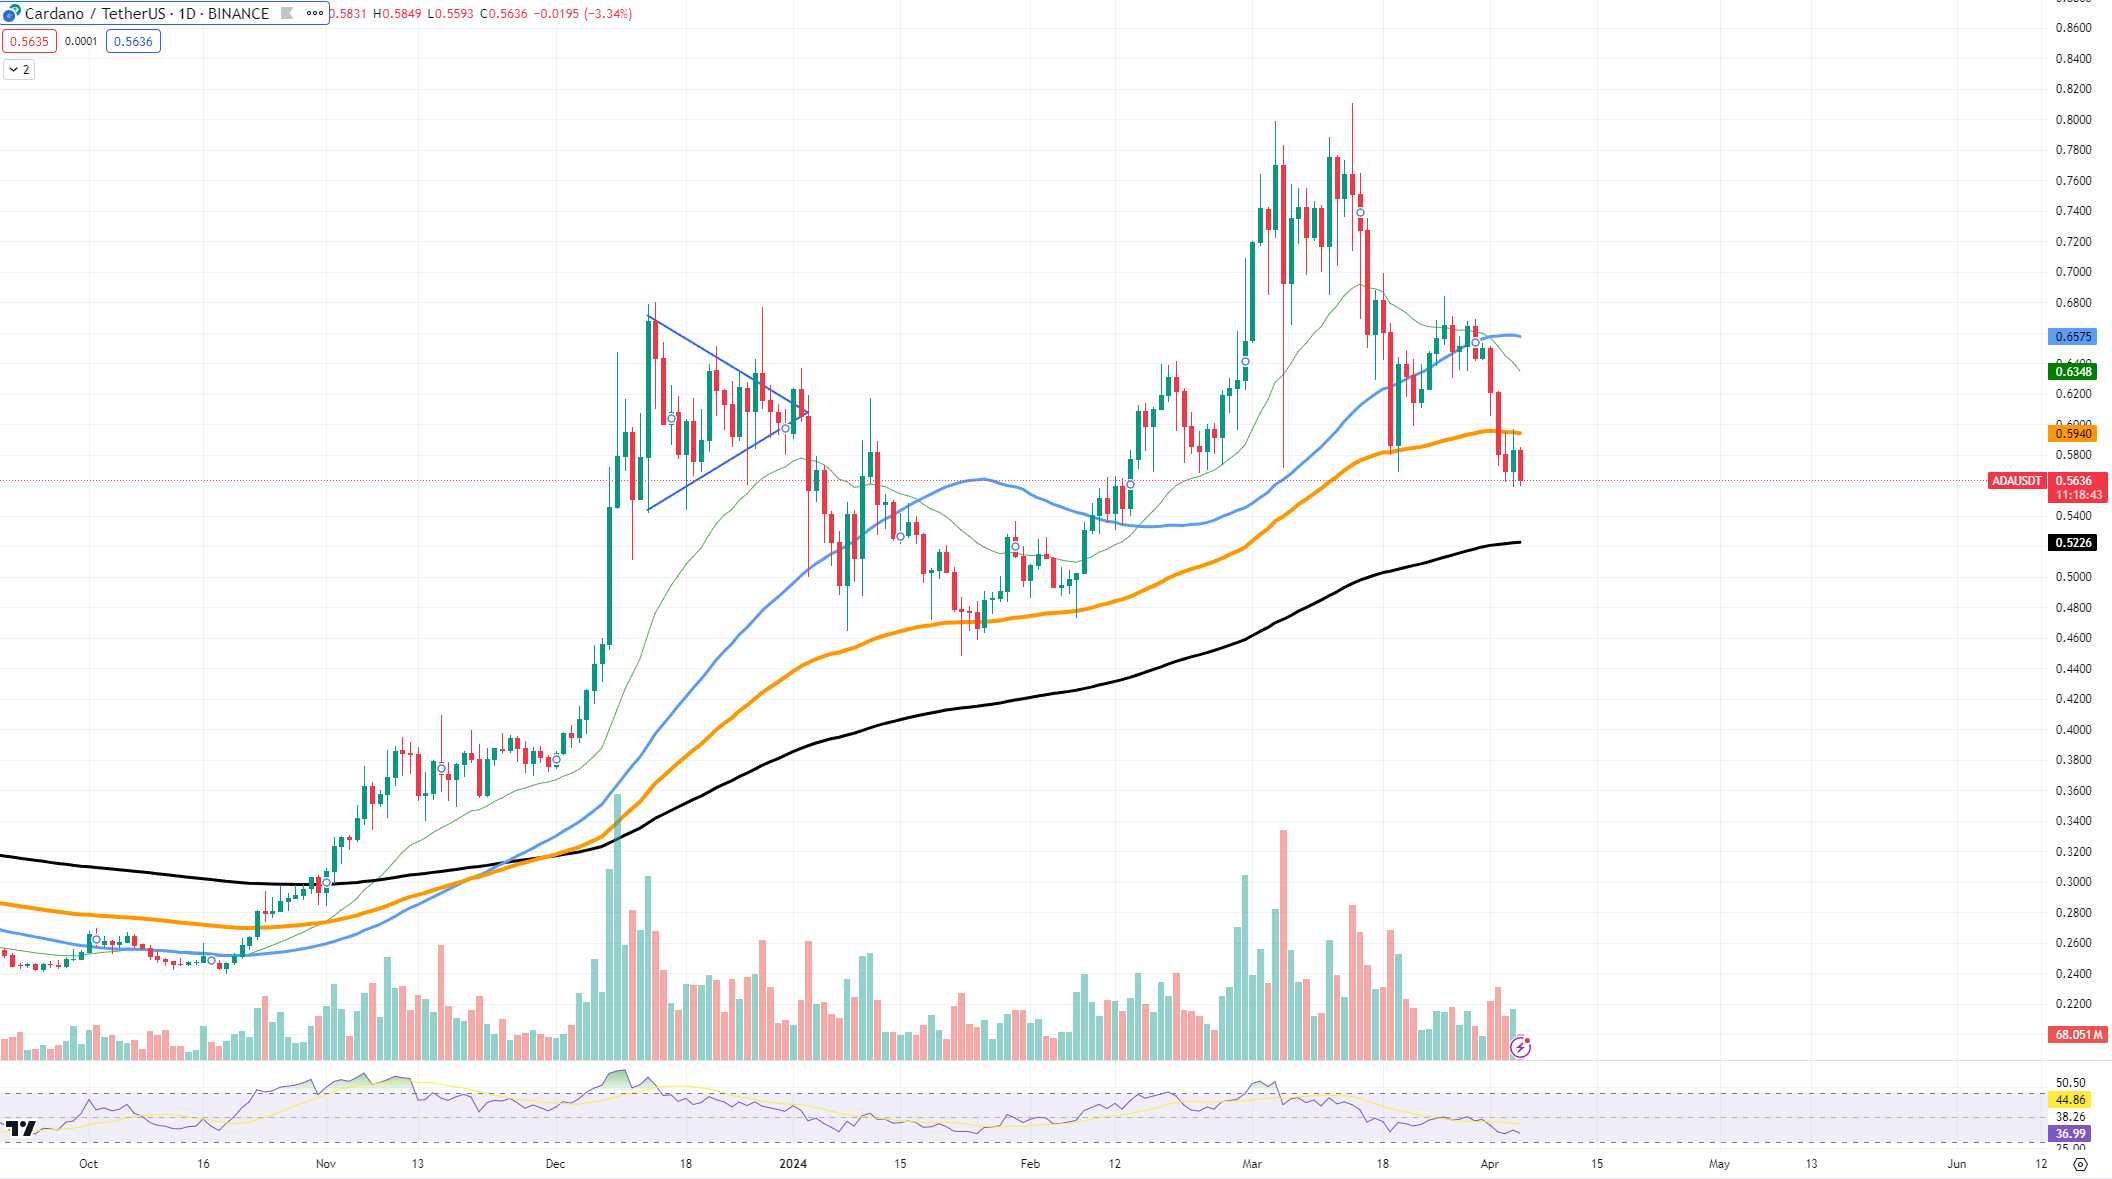
ADA's price is at $0.5686 right now after the most recent correction and the breakdown from the 50 EMA. This drop is significant because the price has gone below what is known as the 21-day Exponential Moving Average (EMA), which was at $0.6576. When the price falls below this line, it often means that an asset losses momentum.
However, there is still hope that Cardano could find some support at the $0.52 mark. This is where the 200-day EMA comes into play and acts as strong lifeline support for the asset.
 ADA/USDT Chart by TradingView
For growth, Cardano needs to climb back above the $0.58 level. If it can do this, the next target could be the 50-day EMA at $0.6352. This would be a good sign that Cardano's price is getting stronger.
The future of ADA now depends on whether it can stay above the $0.52 support level. If it cannot, there might be a bigger drop in price. But if it can, then there is a chance for a recovery.
Solana loses hope
Solana, which once had its sights set on the $200 mark, has seen its aspirations dashed as the market turns bearish. Currently, the price sits at $171.49, a far cry from the heights it had aimed for.
The chart shows Solana's struggle to maintain its upward momentum. After peaking, it has been facing consistent resistance, failing to sustain a rally toward the desired $200 level. The drop below the $180 support level is particularly telling, showing a loss of buyer enthusiasm.
For those eyeing a growth scenario, there is a crucial line in the sand: the 50-day Exponential Moving Average (EMA) at $159.40. If SOL can find support here and bounce back, it may ward off a bearish phase. However, if this level fails to hold, a slide to the 100-day EMA at $132.62 could be on the horizon. This would confirm the fears of those predicting a more significant reversal in Solana's fortunes.
Looking at the larger picture, Solana's recent price patterns suggest a cooling off from the once-heated market interest. This cooling indicates a likely retreat from current levels, potentially signaling the beginning of a longer-term downtrend. The market sentiment is clearly cautious, with the potential for further drops if the 50-day EMA support breaks.
Dogecoin loses some traction
Dogecoin became a favorite of many in this cycle; however, it has recently experienced a significant drop. Despite the positive chatter and a period where it seemed like prices would keep climbing, Dogecoin has faced a rapid decrease, shaking the confidence of its supporters.
The current price shows Dogecoin at $0.17, down 20% from $0.22. This downturn has pushed DOGE below the 50-day Exponential Moving Average (EMA) of $0.1489, a critical indicator that usually suggests whether the price might go up or down. This break below the EMA is a clear sign that the market's previous bullish sentiment has faded.
If there is any hope for growth, Dogecoin needs to recover past the $0.1489 mark and hold steady above this 50-day EMA. If it can do this, the next level to watch is the 21-day EMA at around $0.18. This could indicate that Dogecoin is regaining strength and might start to see its price increase again.


 crypto.ro English
 DogeHome
 Crypto News Land
 ETHNews
 CFN
CFN U_Today
 Thecoinrepublic.com
 Optimisus


