You can also read this news on COINTURK NEWS: Dogecoin (DOGE) Price Analysis and Predictions
Altcoins are continuing the day with losses exceeding 5%, and BTC is struggling to break the support at $40,400. The bearish start to the new week for spot Bitcoin ETFs also contributes to investor anxiety. So, what does the current outlook for Dogecoin tell us? What can investors expect in the coming days?
Dogecoin (DOGE)
Meme coin king’s speculation about integration with payment services is reviving. However, the current regulatory environment and a few statements by Elon Musk indicating his lack of concern for cryptocurrencies suggest that this possibility is increasingly unlikely. This could be why we are not seeing a significant, lasting excitement in the price.
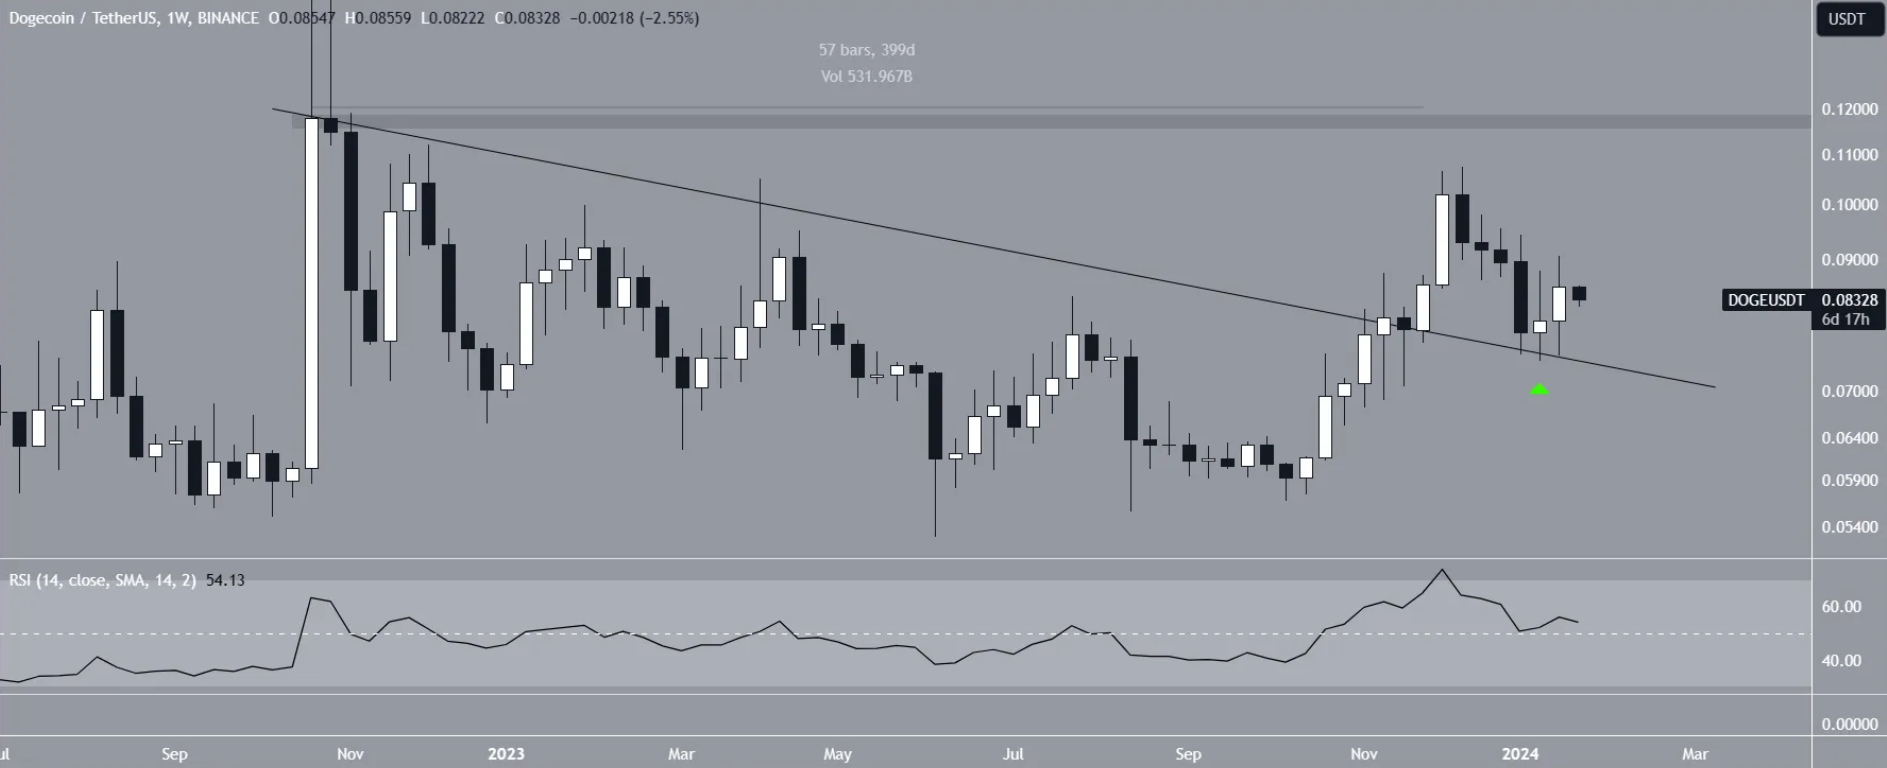
DOGE price continues its movement in a correction formation that was rejected by the resistance trend line yesterday. The weekly chart shows that the DOGE price has been trading below the decreasing trend line since October 2022 and that it was broken after 400 days.

Although the price managed to break free from resistance in November 2023 and rose to $0.107, it has returned to the trend line this month. The RSI is currently in the neutral zone and could support short-term performance if it rises, but BTC is persistent in breaking the $40,400 level downwards, which is against Dogecoin bulls.
DOGE Price Predictions
Analysts like CryptoGodJohn and Birb Nest are fueling rumors about the integration of payment services with DOGE. Pepa says there has never been a better time to buy DOGE, yet the price continues the day with a nearly 4% drop. Perhaps the story of payment services with DOGE is no longer as appealing as it used to be.
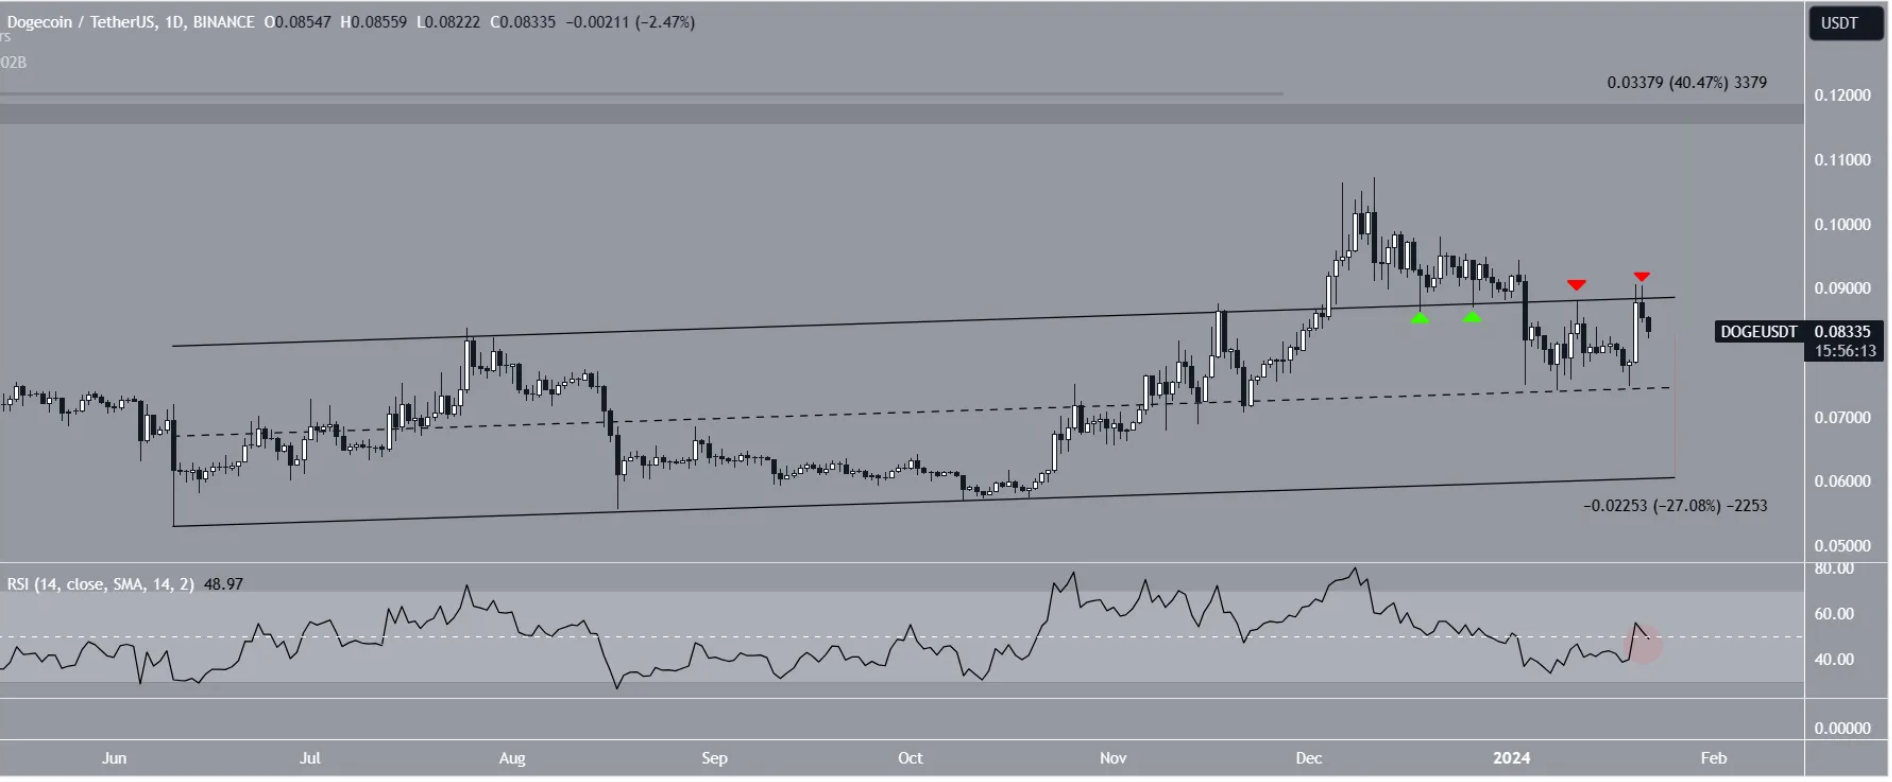
While the weekly chart indicates a rise, daily chart technical readings and RSI suggest the decline could deepen. The price channel that has been falling within the rising parallel channel has not been broken since June 2023.

Even though DOGE bulls managed to escape the channel in December, they could not sustain it. The price, which has confirmed the resistance line twice, the last time being yesterday, indicates that the least resistance is downwards on the daily chart. The daily RSI also remains neutral, signaling an uncertain trend.
There are two scenarios for the price: if a breakout from the channel occurs, a 40% increase to a target of $0.118 could be triggered. In the opposite scenario, a drop to $0.06 is expected.


 DogeHome
 Cryptopolitan_News
 Coin Edition
 BlockchainReporter
 crypto.news
 Crypto Daily™
 BlockchainReporter
 Optimisus


