Dogecoin's Technical Indicators Hint at Potential Surge
Analyst Trader Tardigrade has identified promising technical indicators suggesting that Dogecoin (DOGE) may be poised for a substantial recovery.
Historical Pullback Patterns
Tardigrade highlights a recurring pattern where DOGE experiences significant pullbacks before rallying strongly. The latest price action mirrors past cycles, indicating a potential surge toward $2.
Downward Percentage Correlation
Before each major rebound, DOGE tends to pull back over 50%. In previous cycles, the pullbacks were -59.76% and -56.2%, while the current (third) pullback stands at -58.25%.
Technical Setup and Market Indicators
Tardigrade's analysis (based on a long-term monthly chart) reveals that historical recoveries from deep corrections were followed by parabolic rallies. DOGE's ability to rebound from these levels suggests a structured market behavior, potentially influenced by accumulation phases.
Current Price Action
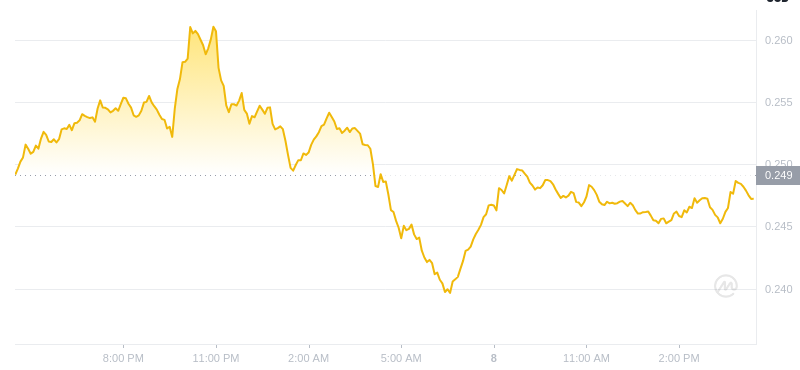
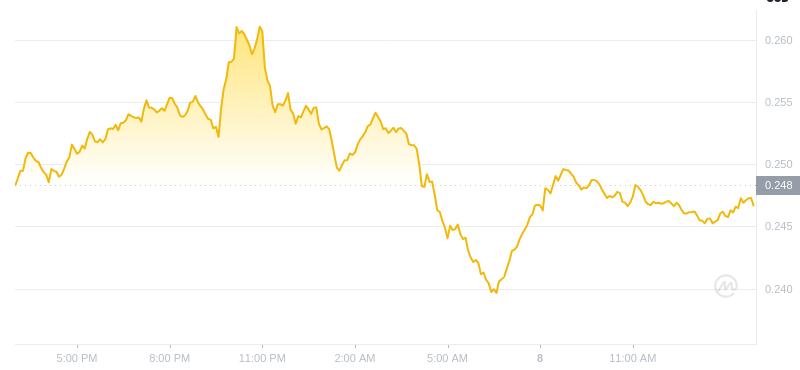
As of publication, DOGE trades at $0.2461 with a daily volume of $1.96 billion. Despite a recent decline, historical patterns indicate that the current price action may represent a final accumulation phase before a strong uptrend.
Potential Breakout
Based on past performance, DOGE's potential breakout could lead to a price target of $2. If momentum and volume increase, DOGE may mirror previous cycles and achieve a substantial price surge.
Conclusion
Historical data suggests that Dogecoin's price movement may be following a well-established trajectory toward higher valuations. While market conditions remain uncertain, Tardigrade's analysis provides insights into possible scenarios for the meme coin's future performance.


 Optimisus
 Optimisus
 ETHNews
 Cryptopolitan_News
 CoinPedia News
 DogeHome
 Crypto News Land
 CaptainAltcoin
 DogeHome


