Dogecoin (DOGE) or Shiba Inu (SHIB): Which Will Yield Higher Returns in June?

Introduction
Despite the recent lull in the crypto market, memecoins have experienced a resurgence, showcasing bullish price action since the start of the week. Top meme tokens have witnessed significant portfolio growth this month, indicating a surge in optimistic sentiment.
Dogecoin: Poised for a Triangle Breakout
Dogecoin, the reigning memecoin, has gained approximately 3.5% in the past 24 hours. While it has maintained a neutral trend over the past week, it has surged 20.1% this month, reflecting a growing bullish outlook within the crypto community.
Moreover, DOGE has a Year-to-Date (YTD) return of 86.34%, suggesting a positive trajectory during the upcoming bull market.

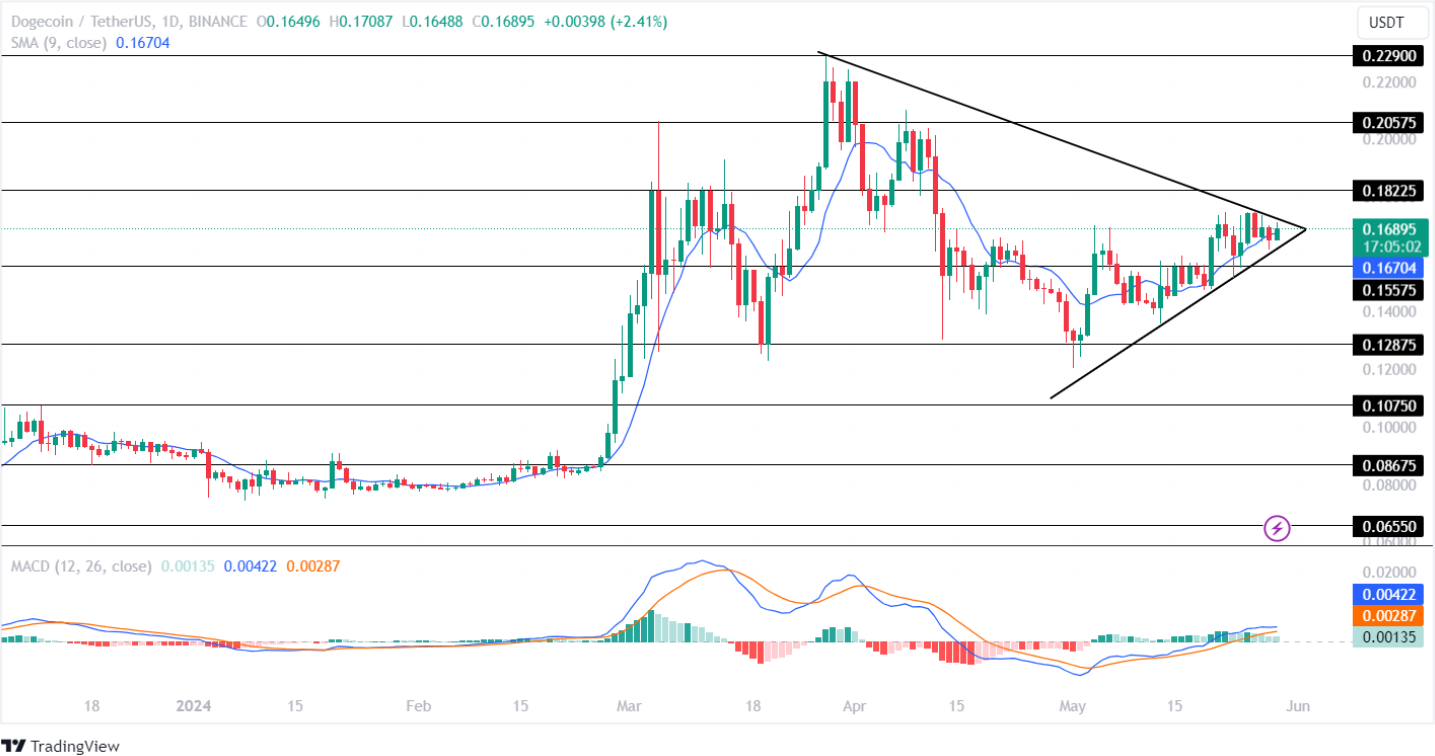
TradingView: DOGE/USDT
Dogecoin's price has formed a symmetrical triangle pattern on the 1D time frame and is poised to break out this week. However, the outcome remains uncertain.
The Moving Average Convergence Divergence (MACD) indicates a gradual decline, suggesting a potential bearish convergence. Additionally, the SMA shows a negative crossover, signaling a weak price movement for DOGE.
If DOGE breaks out of the triangle pattern, the bulls will aim to test the upper resistance level of $0.205. Conversely, a breakdown could lead to a retest of the crucial support level of $0.128.
Shiba Inu: Bullish Breakout on the Horizon
SHIB has successfully retested its critical support level of $0.00002375, resulting in a surge of 8.95% over the past week. The second-largest memecoin by market capitalization has gained 19.89% with a 120% increase in trading volume over the past day. Notably, SHIB has added 174.26% this year, indicating growing investor interest.
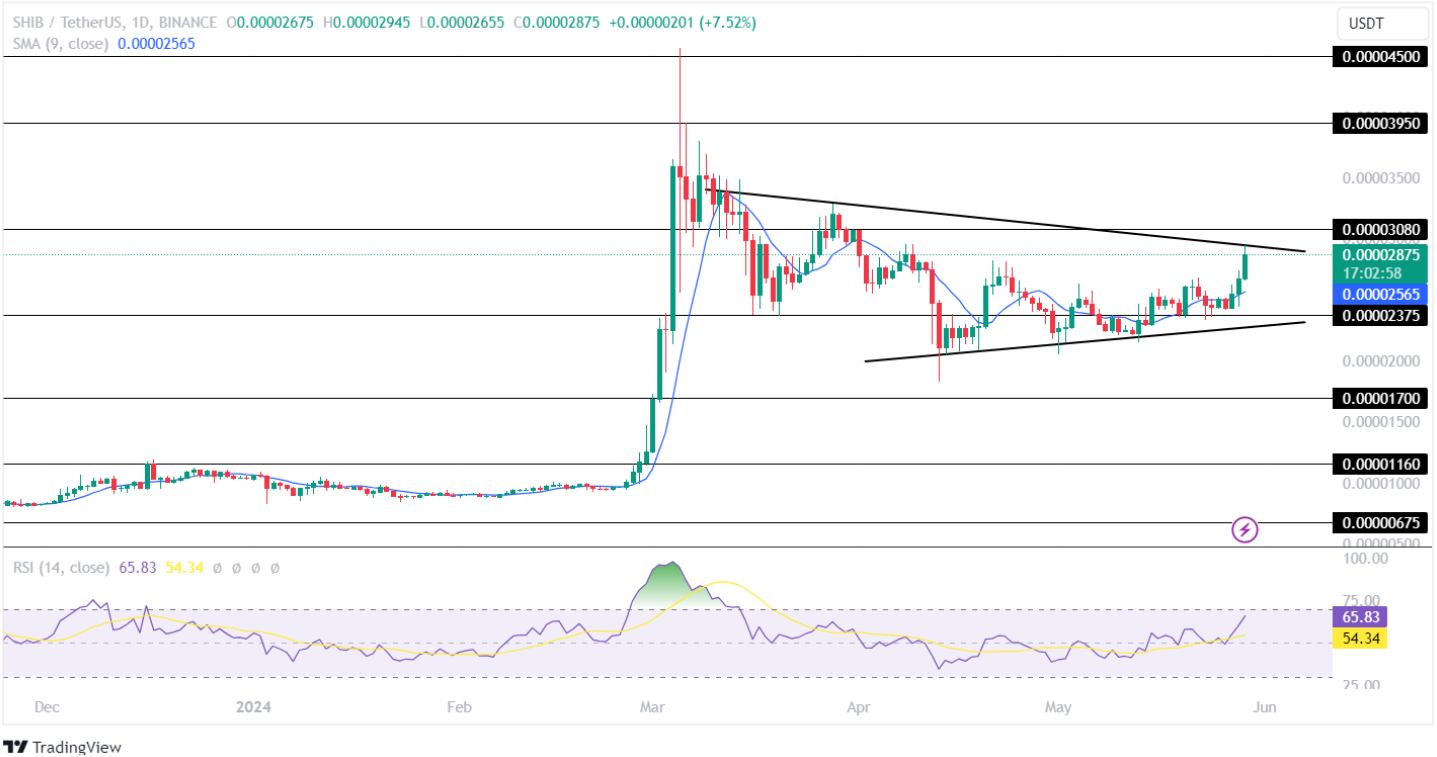
TradingView: SHIB/USDT
Amidst the rising bullish sentiment, SHIB's price is approaching its resistance trendline this week. The Simple Moving Average (SMA) displays a bullish crossover, suggesting a positive outlook for the memecoin in the coming weeks.
The technical indicator, RSI, has retested its midpoint on the 1D time frame, indicating a significant uptrend towards the overbought range.
If the bulls break through the resistance trendline, SHIB will prepare to test its upper resistance level of $0.00003950. However, a trend reversal could lead to a decline towards the support level of $0.00002375.


 TheCoinrise Media
 DogeHome
 Crypto Daily™
 Crypto Daily™
 TheCoinrise Media
 Thecoinrepublic.com
 TheCoinrise Media
 TheCoinrise Media


