

Dogecoin's Price Action Suggests a Bullish Continuation
Dogecoin's historical price action indicates a potential bullish continuation. Periods of consolidation suggest accumulation before significant price increases. This pattern is supported by Fibonacci levels and trend channels, which point to continued upward momentum. Key support lies between $0.16 and $0.19, with long-term price targets potentially exceeding $4. The overall market structure remains strong, characterized by higher highs and higher lows, reinforcing a bullish outlook as Dogecoin approaches a critical breakout zone.
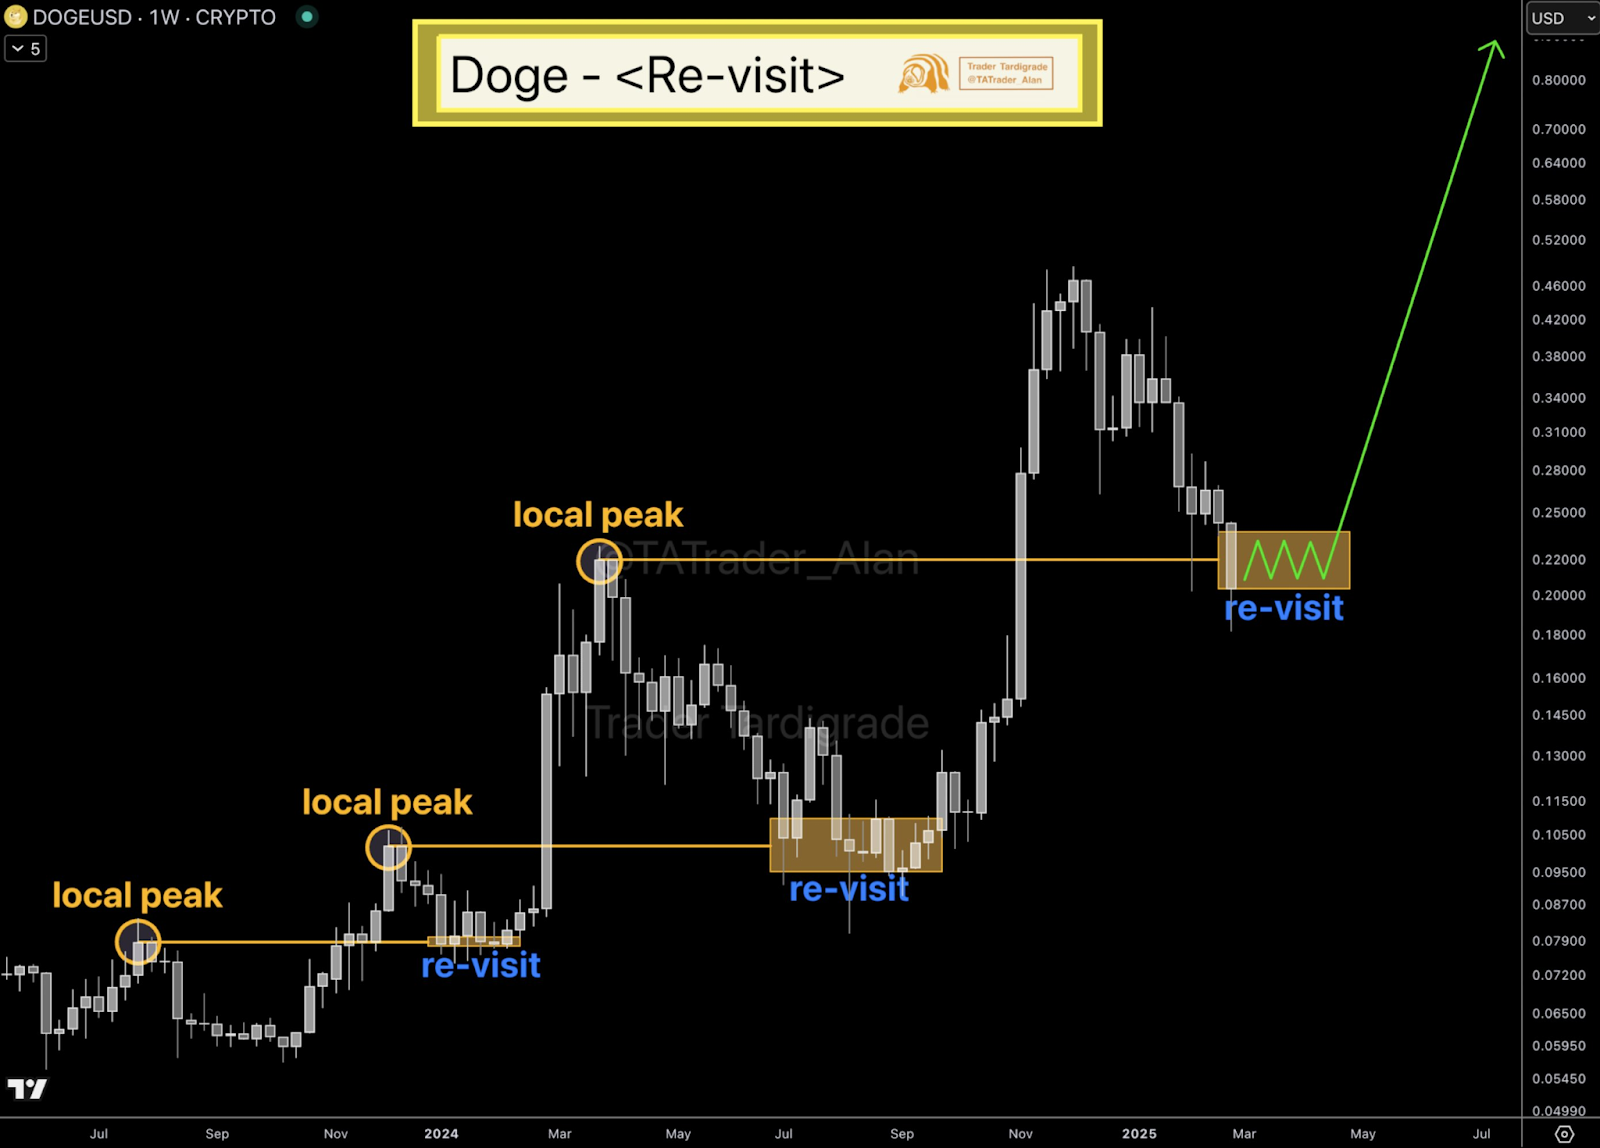
Source: Trader Tardigrade
Repeated Price Tests Show Strength
Trader Tardigrade notes that Dogecoin is currently testing a previous high, a pattern observed before previous rallies. Consolidation around this resistance-turned-support level suggests accumulation, similar to previous instances that preceded strong bullish moves. This historical precedent of higher highs and higher lows strengthens the long-term bullish outlook.
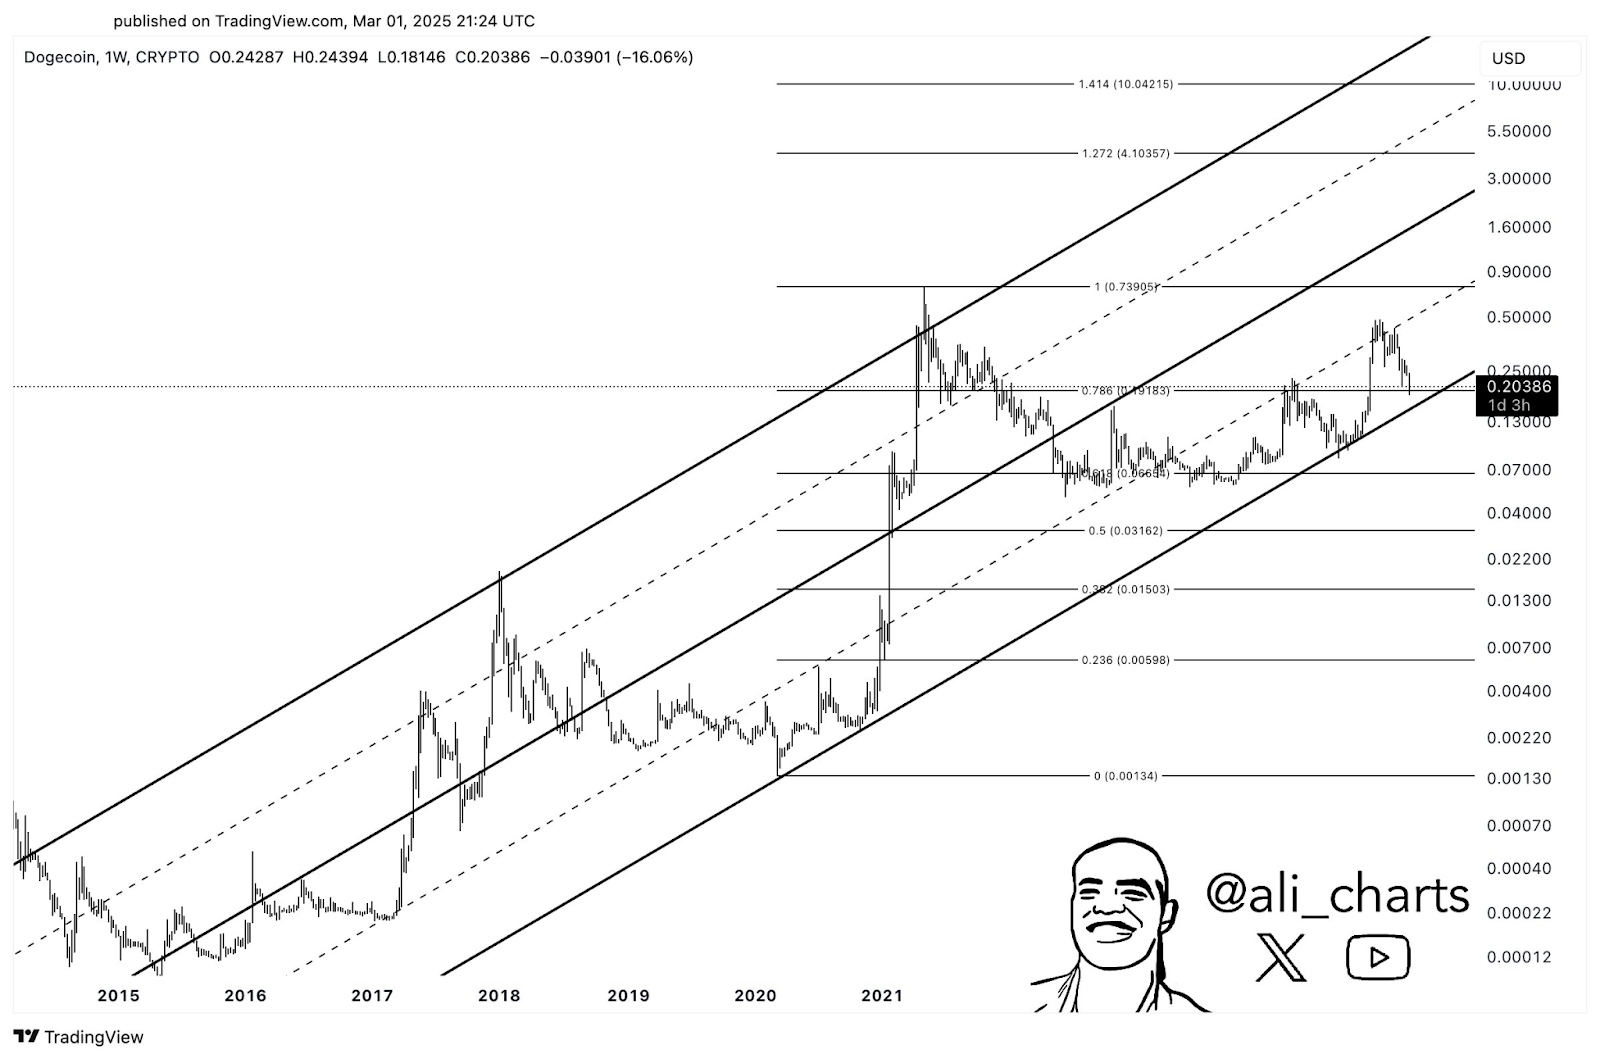
Source: Ali
Fibonacci Support and Trend Channels Reinforce Uptrend
Further supporting the bullish case, Fibonacci retracement levels and trend channels confirm Dogecoin's upward trajectory. The price has found support at the crucial 0.786 Fibonacci level ($0.19183), a pattern seen before prior upward movements. The ascending trend channel remains intact, bolstering the bullish outlook. Maintaining support above the $0.16 to $0.19 range keeps the path open to higher price targets, with Fibonacci extensions suggesting potential long-term targets around $4 ($1.272 extension) and even $10 ($1.414 extension). This aligns with the observed historical price behavior and broader uptrend.
 crypto.news
 Thecryptoupdates
 crypto.news
 BlockchainReporter
 Optimisus
 DogeHome
 CoinoMedia
 Inside Bitcoins


