You can also read this news on COINTURK NEWS: Dogecoin’s Market Challenges and Price Movements
Elon Musk-backed Dogecoin has quickly become a colorful character in the crypto world. However, recent price movements have some investors worried. In particular, Dogecoin‘s performance against the dollar is catching many people’s attention. Today’s decline, although Bitcoin-driven, suggests that failure to recover could lead to a deeper fall.
What Are the Hurdles for Dogecoin?
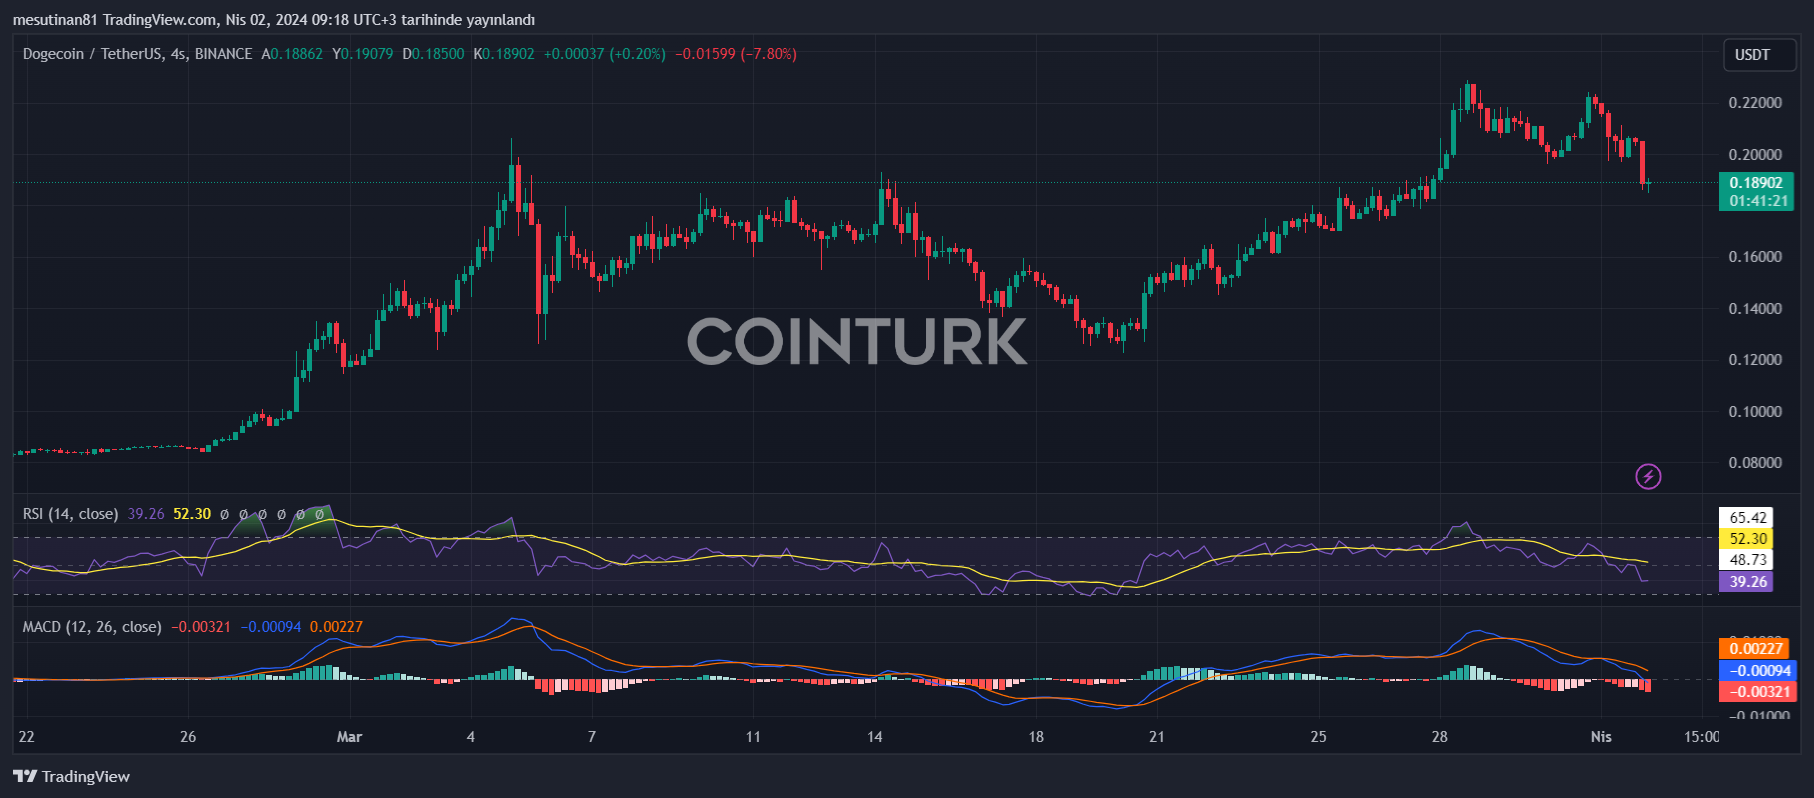
DOGE, which began to correct its gains from the $0.230 region, must now stay above the $0.1750 support area. A close below this support level could hinder the price from rising again.
A key point is that Dogecoin is struggling to stay above $0.225 and is correcting its gains against the US dollar. However, trading above the $0.1750 level and the 100 simple moving average should be considered a positive sign.
What Should Investors Watch for in DOGE’s Price?
Following recent declines, Dogecoin’s price is approaching key support levels. For investors, the decisive factor is whether the price will drop below these support levels and close under $0.1750.
On the upside, the price is expected to encounter resistance near $0.1950. However, the next major resistance is close to $0.200. If the price can overcome this resistance, a move towards the $0.2150 resistance could begin, and it might even rise to the main resistance around $0.2300.
Dogecoin May Continue Its Downward Trend
If DOGE’s price cannot gain momentum above the $0.200 level, it may continue its downward movement. Currently, the first support on the downside is near the $0.1820 level. However, the next significant support level is $0.1750.

If there is a break below the $0.1750 support, DOGE’s price could see further decline. In this scenario, the price could retreat to as low as $0.1480.
What Are the Technical Indicators Telling Us?
Technical indicators are noteworthy for the DOGE/USD pair. The 4-hour MACD is currently gaining momentum in the bearish zone, indicating a potential continuation of the downtrend. Similarly, the 4-hour RSI (Relative Strength Index) is positioned below the 50 level, signaling ongoing selling pressure.
Key support levels include $0.1820, $0.1750, and $0.1480. However, in case of a recovery, resistance levels are determined as $0.2000, $0.2150, and $0.2300.


 Crypto News Land
 Optimisus
 Cryptopolitan_News
 Optimisus
 DogeHome
 Optimisus
 Optimisus
 BlockchainReporter
 BlockchainReporter


