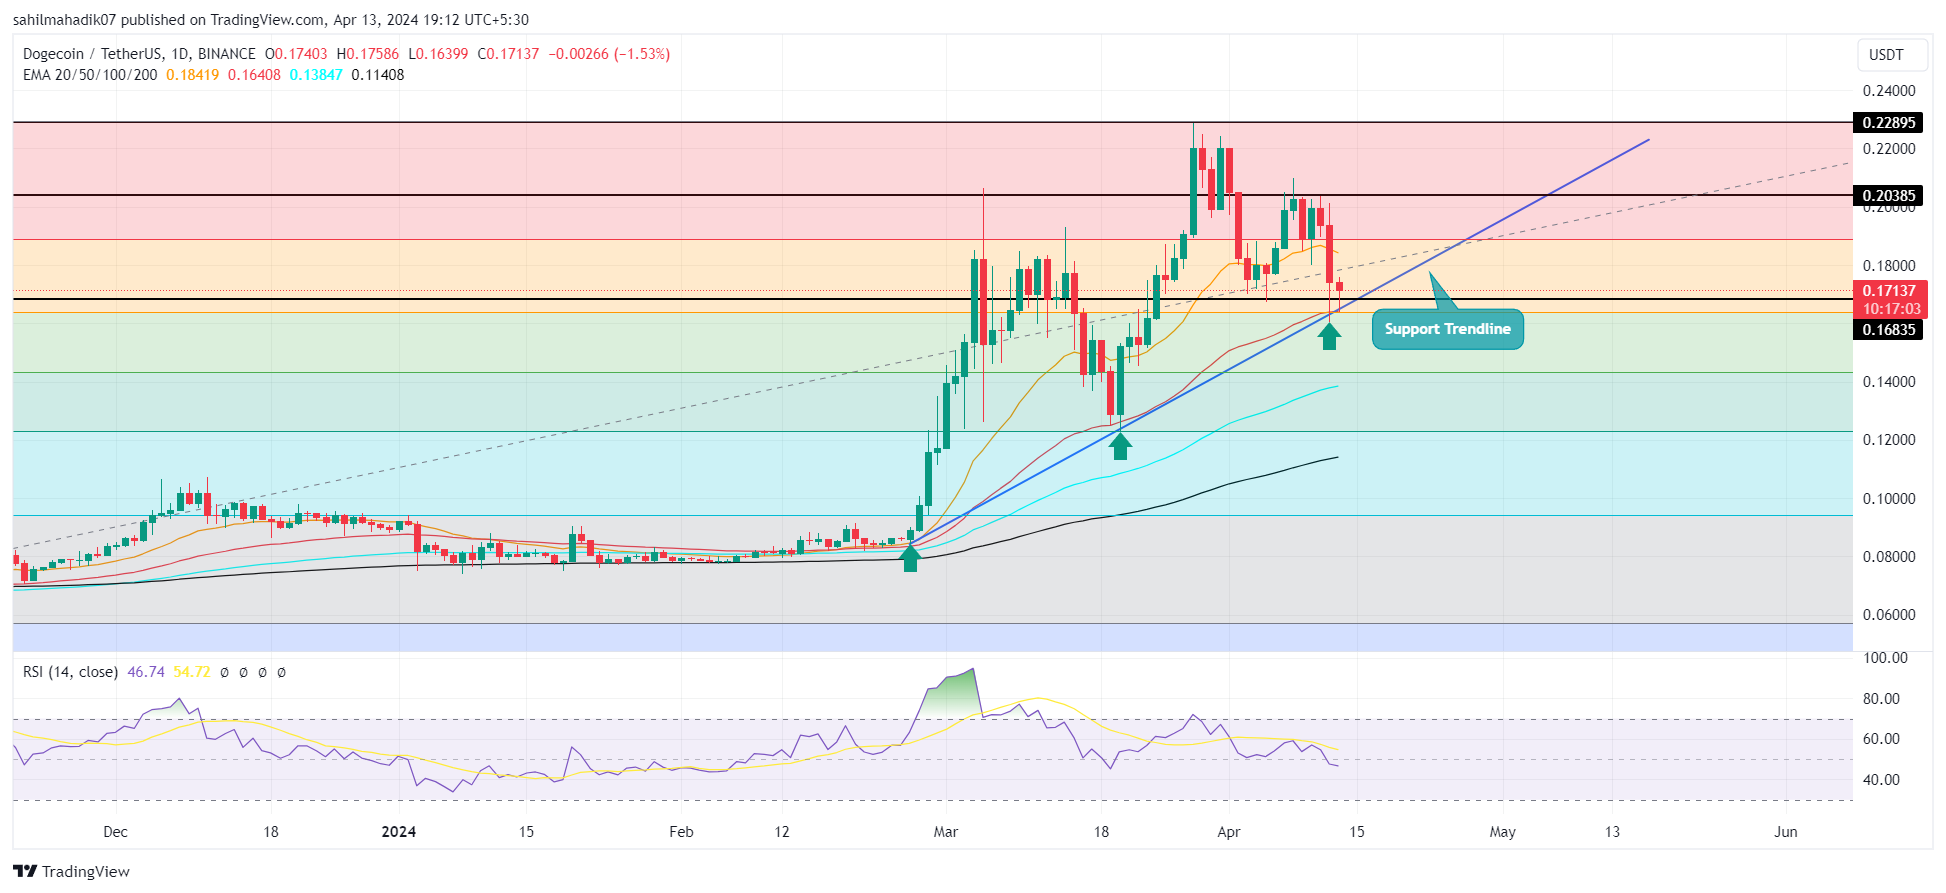
Dogecoin Price Analysis: The second largest meme cryptocurrency Dogecoin has been under a correction trend for over two years and witnessed a drop from $0.228 to $0.17 registering a 28.35% loss. Amid the broader market correction, this asset has showcased a lower high formation in daily charts indicating an early sign of market sentiment shifting from buying on dips to selling on bounces. Is there an opportunity for buyers to counterattack?
Also Read: 6 Meme Coins Crypto To Avoid Until After Halving
Will Dogecoin Price Reclaim $0.2?

The prevailing mid-term outlook for Dogecoin remains positive, tracking along an upward trendline that offers a solid foundation for bulls to possibly mount a comeback. The recent dip in the market saw Dogecoin’s value retract to $0.173, yet it’s still positioned above a pivotal support blend, incorporating the ascending trendline, the 38.2% Fibonacci retracement level, and the 50-day Exponential Moving Average (EMA) curve.
This triple confluence of support zones is a hotspot for buyers, potentially preventing a more extended decline and possibly igniting a rally that could retest resistance levels at $0.2, with sights on an ascent to $0.229.
This confluence of support creates a high area of interest for buyers to prevent prolonged downfall. Sustaining this support will rebound the DOGE price high and rechallenge the overhead resistance at $0.2, followed by $0.229.
Also Read: Dogecoin and Other Meme Coins Tank But Traders Are Buying This Token on the Dip
Massive DOGE Transfer to Robinhood Could Signal Downward Shift
A recent Whale Alert tweet flagged a massive Dogecoin transaction where 74 million DOGE, worth over $12.5 million, was moved to Robinhood. This notable transaction amid current market consolidation hints the DOGE price prolongs its downward trajectory.
74,024,901 #DOGE (12,583,531 USD) transferred from unknown wallet to #Robinhoodhttps://t.co/H9KdL5hAwY
— Whale Alert (@whale_alert) April 13, 2024
Thus, a breakdown below the aforementioned trendline may intensify the supply pressure and plunge the asset back to $0.122.
Also Read: Dogecoin (DOGE)’s Latest Surge: But Can It Compete with O2T’s Groundbreaking 400% Rally?
Technical Indicator
- Relative Strength Index: The daily RSI slope below 47% reflects a neutral to bearish sentiment among market participants.
- Exponential Moving Average: The memecoin price trading above daily EMAs(50, 100, and 200) the broader trend remains bullish.
The post Dogecoin Price Analysis: Key Support Levels To Watch Amid Market Sell-off appeared first on CoinGape.


 crypto.ro English
 DogeHome
 Crypto News Land
 ETHNews
 CFN
CFN U_Today
 Thecoinrepublic.com
 Optimisus


