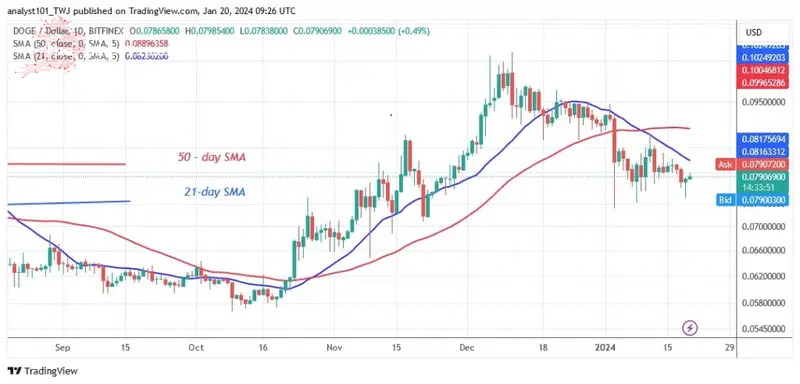
The price of Dogecoin (DOGE) has been below the moving average lines since the price slump on January 3, 2024.
Long-term forecast for the Dogecoin price: bearish
Selling pressure has paused above the current support level of $0.073. The bears have not been able to sustain their bearish momentum to the $0.070 level over the past two weeks.
Nonetheless, the cryptocurrency fell to the lows of $0.074 and $0.075 before correcting higher. DOGE is currently trading at $0.074 and below the moving average lines. The market will fall above $0.070 if the current support level is broken. At this point, the altcoin is trading at $0.079.
Dogecoin indicator reading
The price bars have remained below the moving average lines for the past week, but the price action has stopped above the current support. The price bars are characterized by small, uncertain candlesticks known as dojis. DOGE is showing a bearish crossover with the 21-day SMA falling below the 50-day SMA.
Technical Indicators
Key resistance levels – $0.12 and $0.14
Key support levels – $0.06 and $0.04

What is the next direction for Dogecoin?
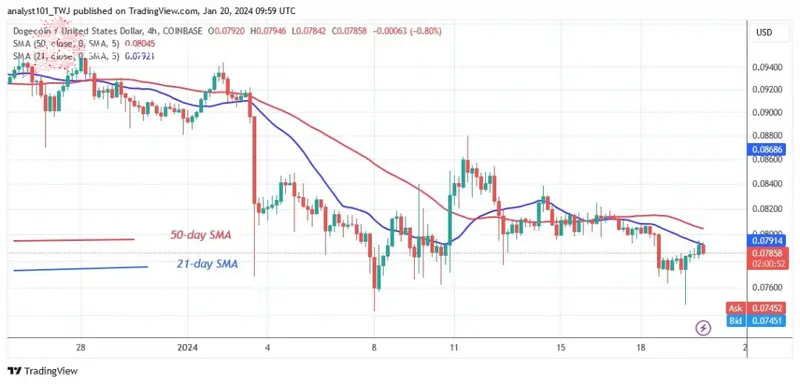
After the price drop on January 3, DOGE is moving sideways on the 4-hour chart. The price of the altcoin is currently hovering between $0.076 and $0.086. The moving average lines have limited the upside. DOGE is in a downtrend as it is rejected at the 21-day SMA.

Last week analyses predicted that DOGE/USD could fall further to the low of $0.070. This is because the resistance at $0.087 and the moving average lines were rejecting each other.
Disclaimer. This Analysis and forecast are the personal opinions of the author and are not a recommendation to buy or sell cryptocurrency and should not be viewed as an endorsement by CoinIdol.com. Readers should do the research before investing in funds.


 CFN
CFN U_Today
 Thecoinrepublic.com
 DogeHome
 Optimisus
 Optimisus
 DeFi Planet
 Crypto Daily™
 BlockchainReporter


