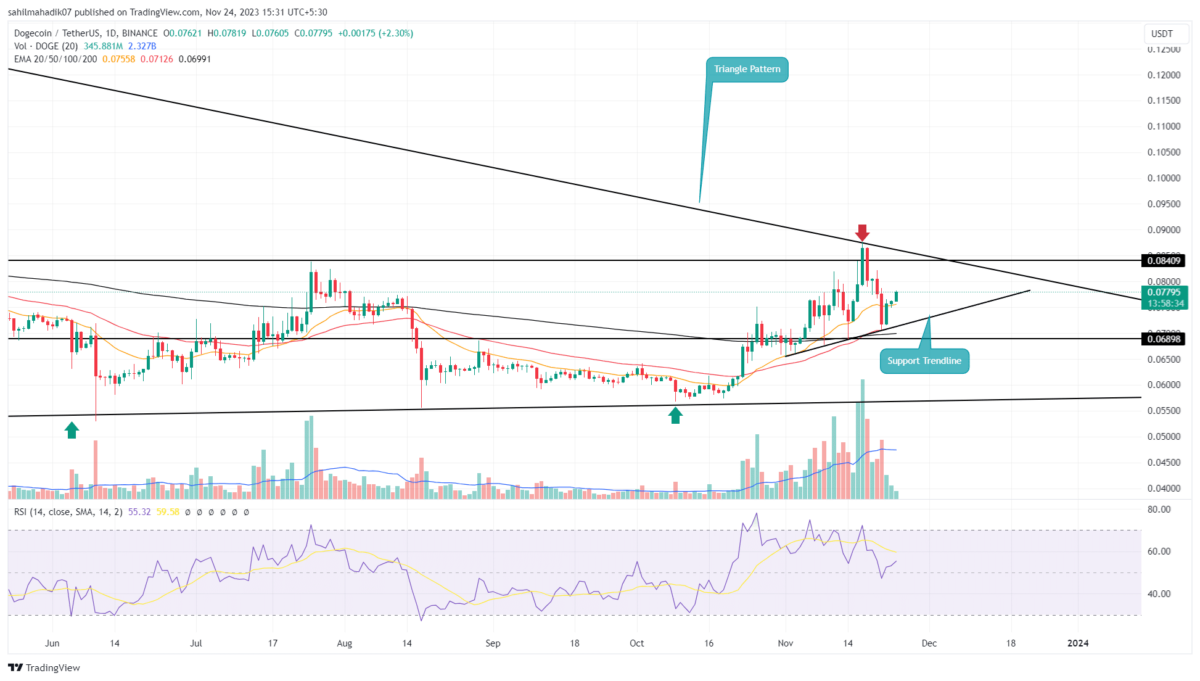
Dogecoin Price Prediction: On November 18, the DOGE price witnessed a pivotal reversal from the resistance line of a symmetrical triangle pattern that has significantly influenced its price trajectory for nearly two years. This shift resulted in an 18% drop in Doge value, marking a weekly low of $0.0706. Can we expect this downward trend to persist?
Also Read: Dogecoin Whale Activity on the Rise, DOGE Price to $0.1?
Dogecoin Price Prediction: Triangle Pattern Govern Price Behaviour
- The rising DOGE price witnessed intense supply pressure around the $0.085 mark.
- The 50-day EMA slope continues to act as dynamic support
- The 24-hour trading volume in Dogecoin is $312 Million, indicating a 17% decrease.
 Source-Tradingview
Amidst a recent uptick in the cryptocurrency market, Dogecoin price found support at the psychologically significant level of $0.07. Over the past three days, buyers have recovered 10% of lost value, bringing it to $0.0777.
If this bullish momentum continues, we could see a further 10% increase, potentially challenging the upper trendline of the symmetrical triangle at around $0.085. Historically, each encounter with this trendline has led to a substantial drop, often retreating to the triangle’s lower trendline.
Hence, a potential clash at this level might incite substantial selling pressure, leading to a bearish reversal to the new emerging support trendline(black). A breach below this point could signal a more pronounced correction, possibly resulting in a 25% decline from the current trading price to reach the lower boundary.
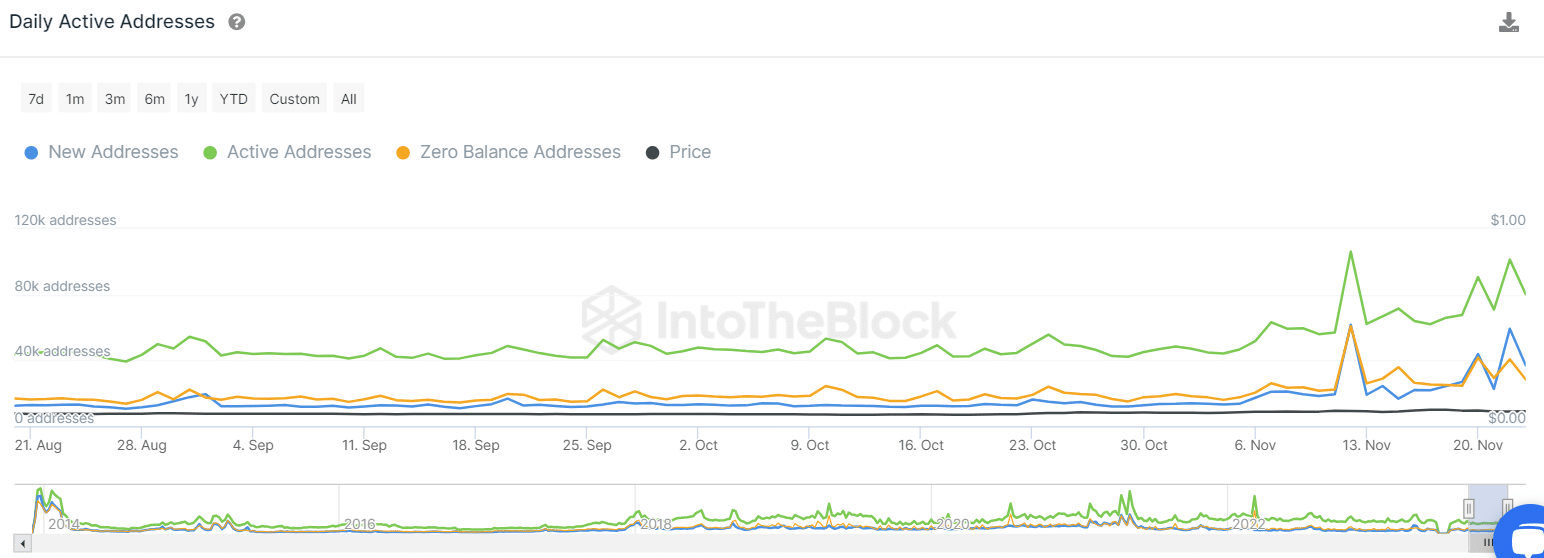
Growth In the Dogecoin Addresses
 Source- Intotheblock
This on-chain metric serves as an indicator of the network’s actual utilization and activity of users on the blockchain. This month has seen a notable uptick in the creation of new Dogecoin addresses and active user engagement, coinciding with the token’s price recovery. This surge in activity is likely spurred by recent developments, including the announcement of physical Dogecoin and Bitcoin tokens scheduled to be sent to the moon on December 23rd.
- Exponential Moving Averages: The coin price above the crucial EMAs(20, 50,100. and 200) day EMA, suggesting that the short-term recovery is in place.
- Relative Strength Index: The daily RSI around 54.69 reflects a neutral stance, however, the downward slope on the indicator, hints at a decrease in buying momentum.
The post Dogecoin Price Prediction Hints 10% Jump Ahead, But There a Twist appeared first on CoinGape.


 DogeHome
 TheCoinrise Media
 Thecoinrepublic.com
 TheCoinrise Media
 TheCoinrise Media
 Cryptopolitan_News
 Coin Edition
 BlockchainReporter


