Dogecoin Price Analysis: Bullish Trend or Temporary Dip?
Dogecoin has displayed impressive gains over an extended period. Notably, it surged by 366% from October to early December.
However, buyers faced exhaustion in December and have been securing profits. Consequent sell-offs have caused a significant 32% decline in Dogecoin's price.
The price initially rose by leveraging support from a trendline. However, buyer sentiment weakened, leading to a break below the trendline and a continuous downtrend.
Despite this setback, Dogecoin remains the dominant meme coin in terms of market capitalization. Analysts anticipate a potential bull run after the recent correction.
Potential Bull Run on the Horizon
Crypto analyst Trader Tradigrade believes that Dogecoin's price trajectory conforms to a specific pattern. Based on this analysis, he expects another bull run.
According to Tradigrade, the price has completed a three-year accumulation phase and is poised to move beyond this stage. The weekly timeframe indicates a minor dip, followed by an anticipated surge.
Key Technical Levels
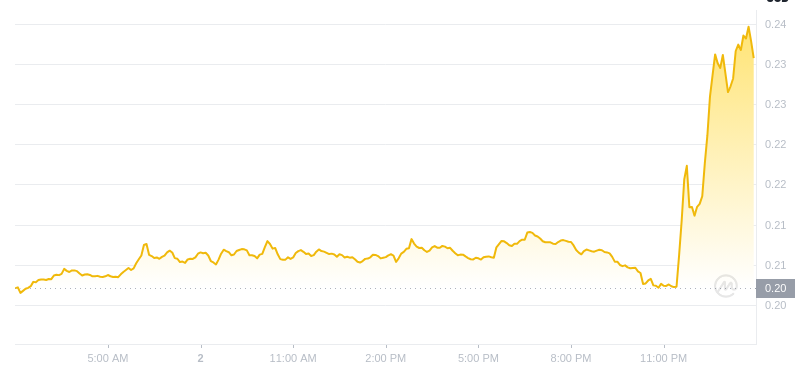
At the time of writing, Dogecoin was trading at $0.315, down by 5.32% in the previous 24 hours. Market capitalization stood at $46.58 billion, with a 24-hour trading volume of $2.54 billion.
The technical chart suggests that the price was holding support at $0.300. However, after a brief pause in bearish momentum, it has lost around 6% intraday. This selling pressure could heighten buyer anxiety.
A drop below $0.300 could trigger intensified selling pressure, potentially driving the price towards the 200-day EMA. Breaking below the 200-day EMA could make it challenging for buyers to regain momentum.
Conversely, a successful defense of $0.300 would signal bullishness. Buyers may show interest if the price surpasses the 20-day EMA. Sustaining above this level could lead to a strong rally and potentially new all-time highs.
Expert Insights
Analysts maintain that despite the recent downturn, a bullish recovery is plausible if the price holds above key resistance levels, particularly the 20-day EMA.
Upholding the $0.300 support level could pave the way for an upward trend, possibly resulting in new highs. However, a fall below this level may escalate selling and hinder the recovery. Investors should monitor these developments closely to inform their investment strategies.


 BlockchainReporter
 DogeHome
 Cryptopolitan_News
 U_Today
 crypto.news
 DogeHome
 crypto.news
 Crypto News Land
 BlockchainReporter


