Pepe Coin Price Correction Continues
In the past 24 hours, Pepe coin has experienced a price correction of 3.86%, dropping to $0.00000795. This follows a brief surge a few days ago. Could the price correction continue?
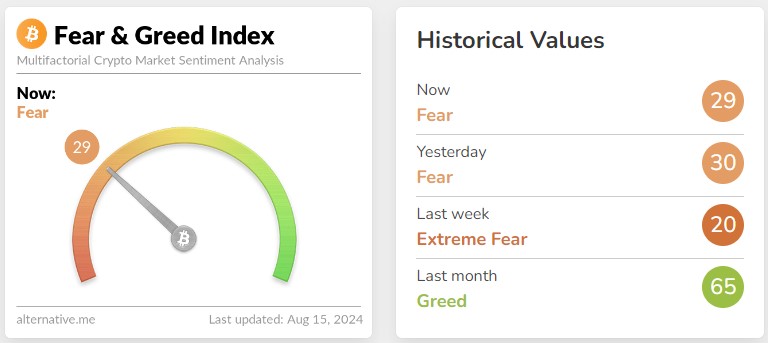
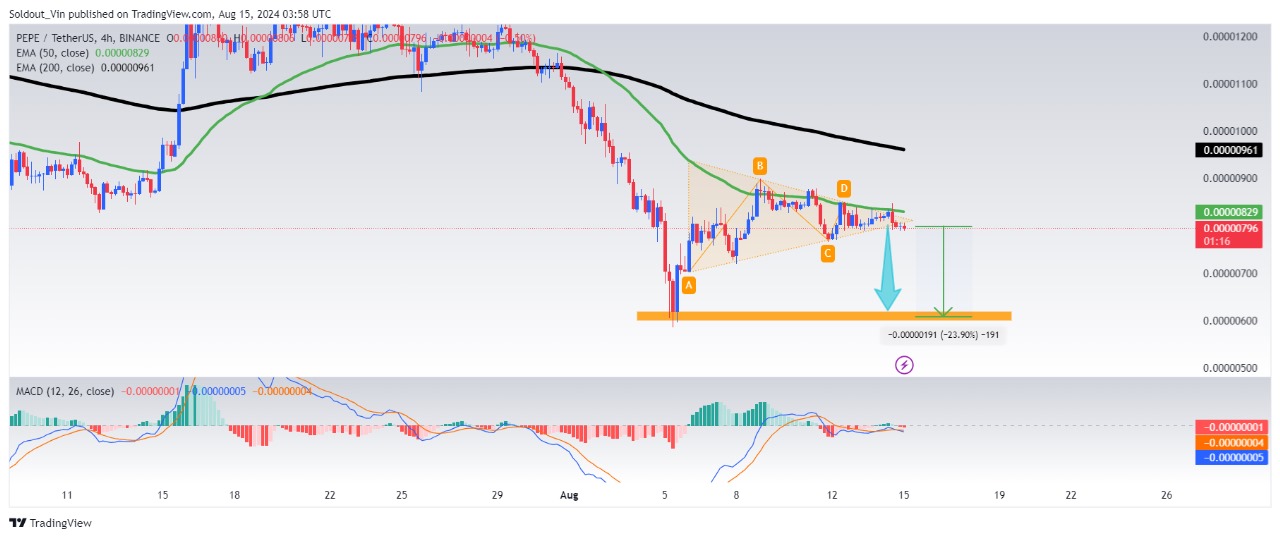
The correction is part of a broader decline in the global cryptocurrency market, with the Crypto Fear and Greed Index falling from 30 to 29 within the same period. Crypto market capitalization has also dropped 3% to $2.07 trillion in a day, according to Coinmarketcap.
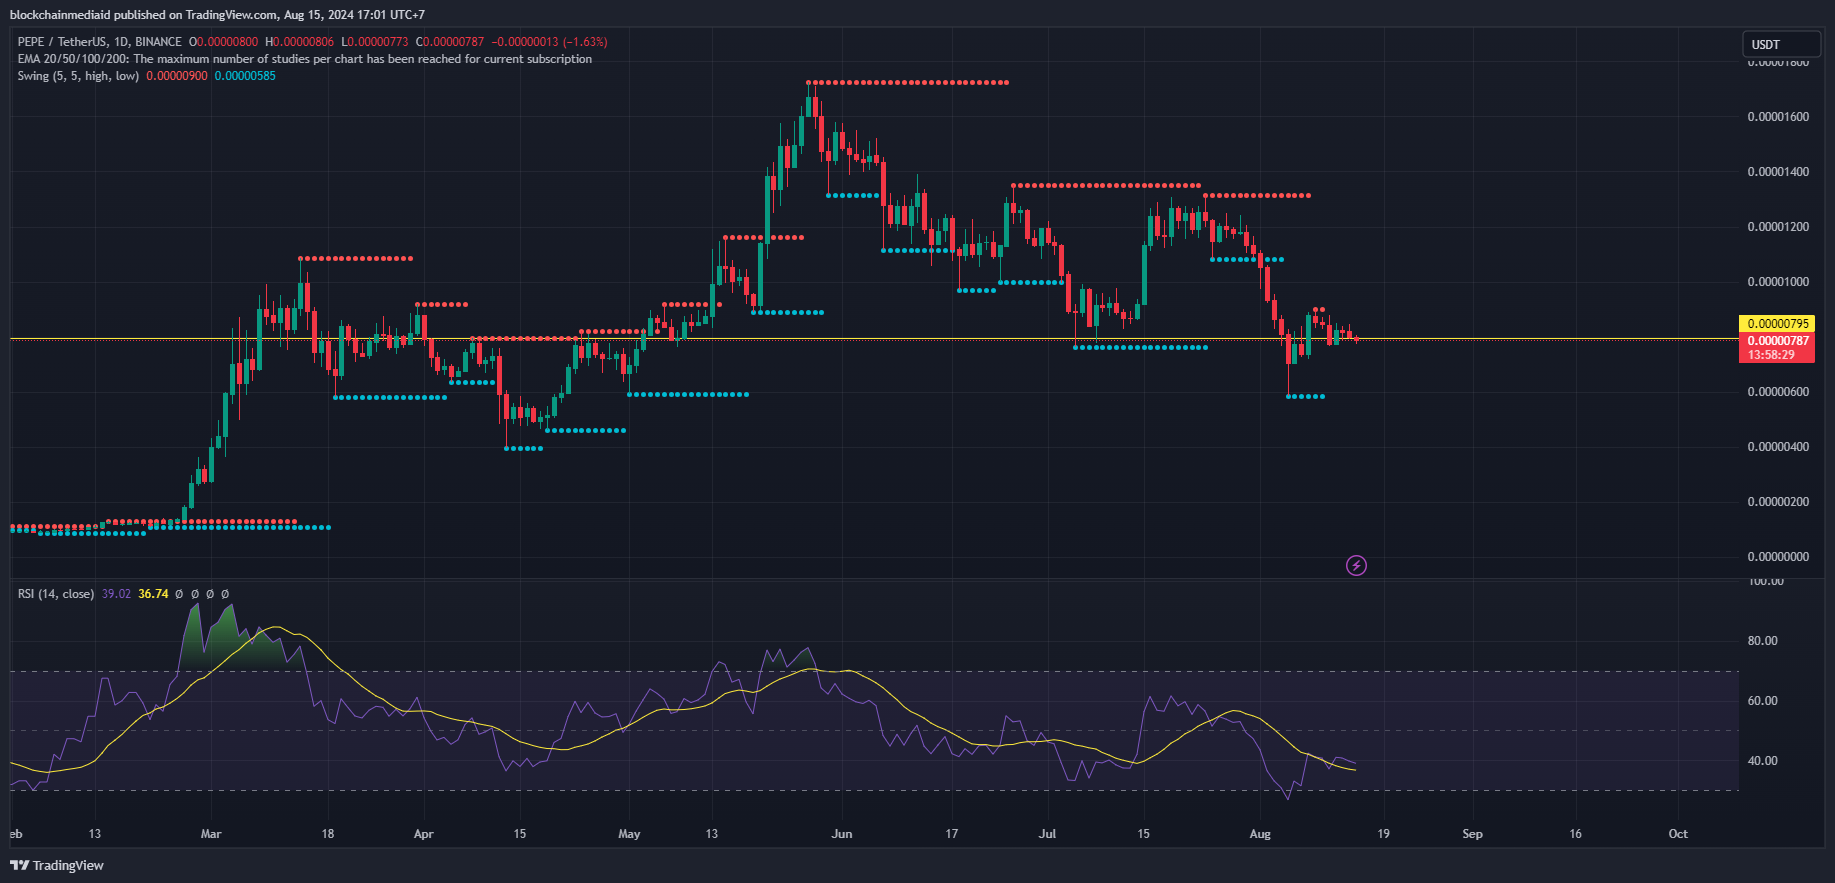
Technical Analysis: Correction May Continue
According to Coingape, Pepe coin is in a bearish zone based on its technicals and has formed a symmetrical triangle pattern. This pattern often indicates that downward pressure may continue.
"The PEPE price is in a clear downtrend marked by lower highs and lower lows, forming a symmetrical triangle pattern. The price is currently trading below both the 50-day Exponential Moving Average (EMA) of $0.00000829 and the 200-day EMA of $0.00000961, adding further confirmation to the downtrend. The recent break below the triangle pattern suggests a continuation of the downtrend. Pepe Coin could potentially find support around $0.00000700, with the previous low being $0.00000600," writes Coingape.
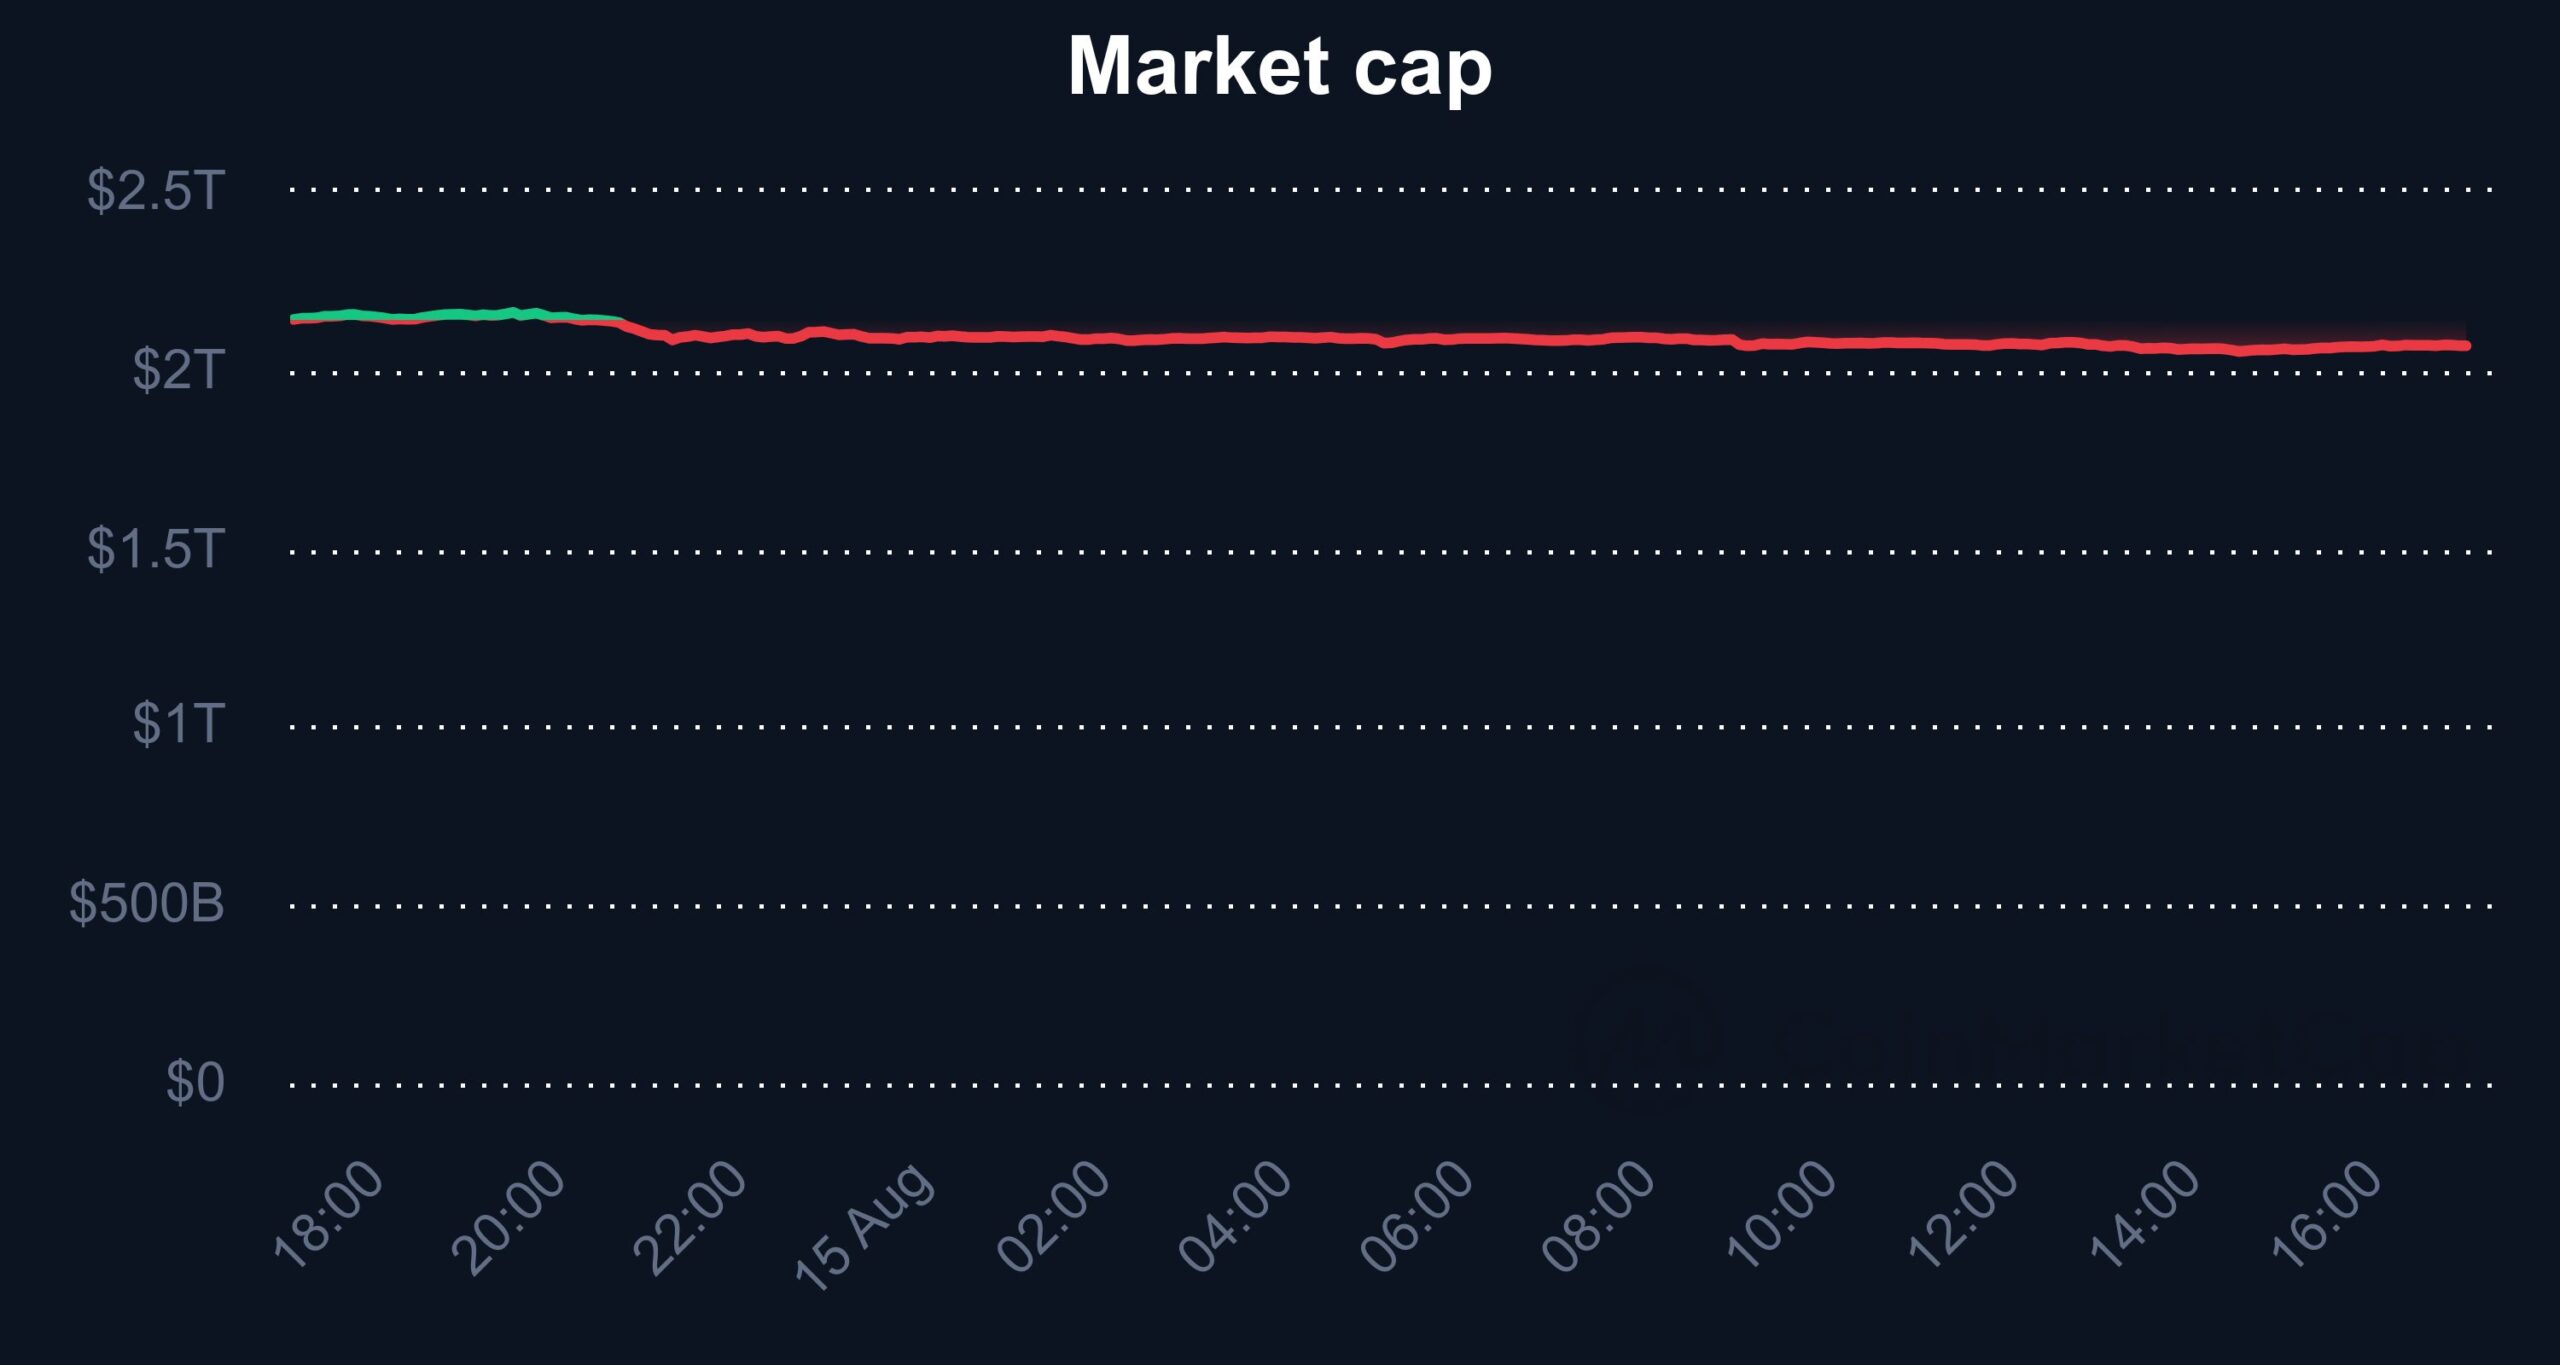
A symmetrical triangle is a reversal or continuation pattern commonly used in technical analysis. It forms when the price action moves within a narrowing range, with trendlines connecting the descending highs and ascending lows.
This pattern indicates consolidation; in PEPE's case, it means price volatility is decreasing, and the market is relatively calm. When the price finally breaks out of one of the trendlines, either upwards or downwards, it can signal the beginning of a new trend. A bullish signal is usually given when the price breaks out upwards, while a bearish signal is given when it breaks out downwards. In this case, the recent breakout below the lower trendline suggests a potential continuation of the downtrend.
This is further supported by the Moving Average Convergence Divergence (MACD) histogram, which shows a bearish signal with increasing downward momentum. When the MACD histogram is below zero and forming increasingly longer negative bars, it indicates growing downward momentum in PEPE's price. This means that selling pressure is dominant, and the price is likely to continue falling with more intensity.
Whale Activity
However, other data suggests a different trend. On-chain data, which tracks transactions on the blockchain, reveals an increase in whale activity for PEPE in the past 48 hours.
Data from IntoTheBlock indicates a 192% surge in large-holder (whale) inflows between August 13th and 14th, 2024, signaling bullish sentiment towards the asset amid the PEPE price correction.
Additionally, PEPE's netflow data shows a negative reading on August 14th, according to Coinglass. The previous day, around $5.95 million worth of PEPE entered exchanges, a rise from the positive netflow of $1.27 million the day before.
This, coupled with the increase in whale holdings, suggests that large investors may be accumulating Pepe Coin at lower prices during the correction, anticipating a potential bullish trend reversal.
Analysis of PEPE's Large Order Book data shows whale buy orders worth $2.6 million at prices around $0.00000579 and $0.00000670. These orders have been waiting for 9 days, indicating that whales are positioned to buy more PEPE tokens at lower levels. This could potentially drive the price of Pepe Coin higher, given the demand from large investors willing to buy at discounted prices.


 Coincu
 Crypto Intelligence
 Optimisus
 DogeHome
 ItsBitcoinWorld
 Optimisus
 Inside Bitcoins
 CoinDesk
 Crypto Daily™


