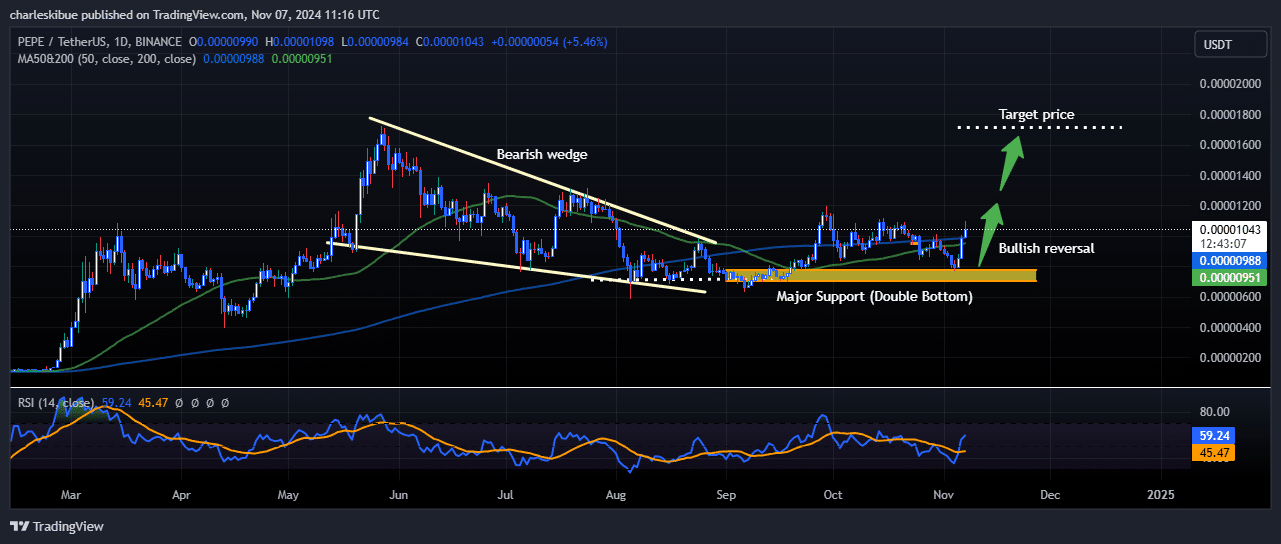
The Pepe price has soared 10% in the last 24 hours to trade at $0.00001041 as of 7:15 a.m. EST on a 7% drop in trading volume to $2.5 billion.
Pepe Price Spikes in Successive Bullish Candles
The daily chart of the PEPE/USDT pair shows a series of technical patterns indicating a potential bullish trend. Initially, the price was in a downtrend, forming a bearish wedge pattern from March to August.
This wedge featured descending resistance and support lines, a setup that often hints at an impending reversal. In August, the price broke above the wedge, signaling a shift in momentum.
The price established a significant support level near $0.000000951, creating a double-bottom pattern. This formation is bullish, indicating that buyers are defending this level and possibly preparing for a trend reversal. This support has held strong, making it a critical price floor for future movements.

Pepe Price Indicators Support the Bullish Reversal
After retesting the support level, the Pepe price started to rise, suggesting a bullish reversal that could target higher levels. The chart highlights a potential target price around $0.000001400, a likely next resistance if the current bullish momentum continues.
The Relative Strength Index (RSI) at the bottom of the chart is around 59.24, which is in the neutral-to-bullish range. An RSI above 50 generally supports a bullish outlook, and with the current reading not yet overbought, there may be room for further upward movement.
The outlook for PEPE is positive, with a strong base at major support, a breakout above a bearish wedge, and supportive signals from moving averages and RSI. If the bullish trend persists, the price could aim for the target level near $0.000001400.


 CFN
CFN Cryptopolitan_News
 DogeHome
 Optimisus
 U_Today
 WalletInvestor
 Crypto.ro
 Cryptopolitan_News


