Shiba Inu (SHIB): Poised for a Breakout
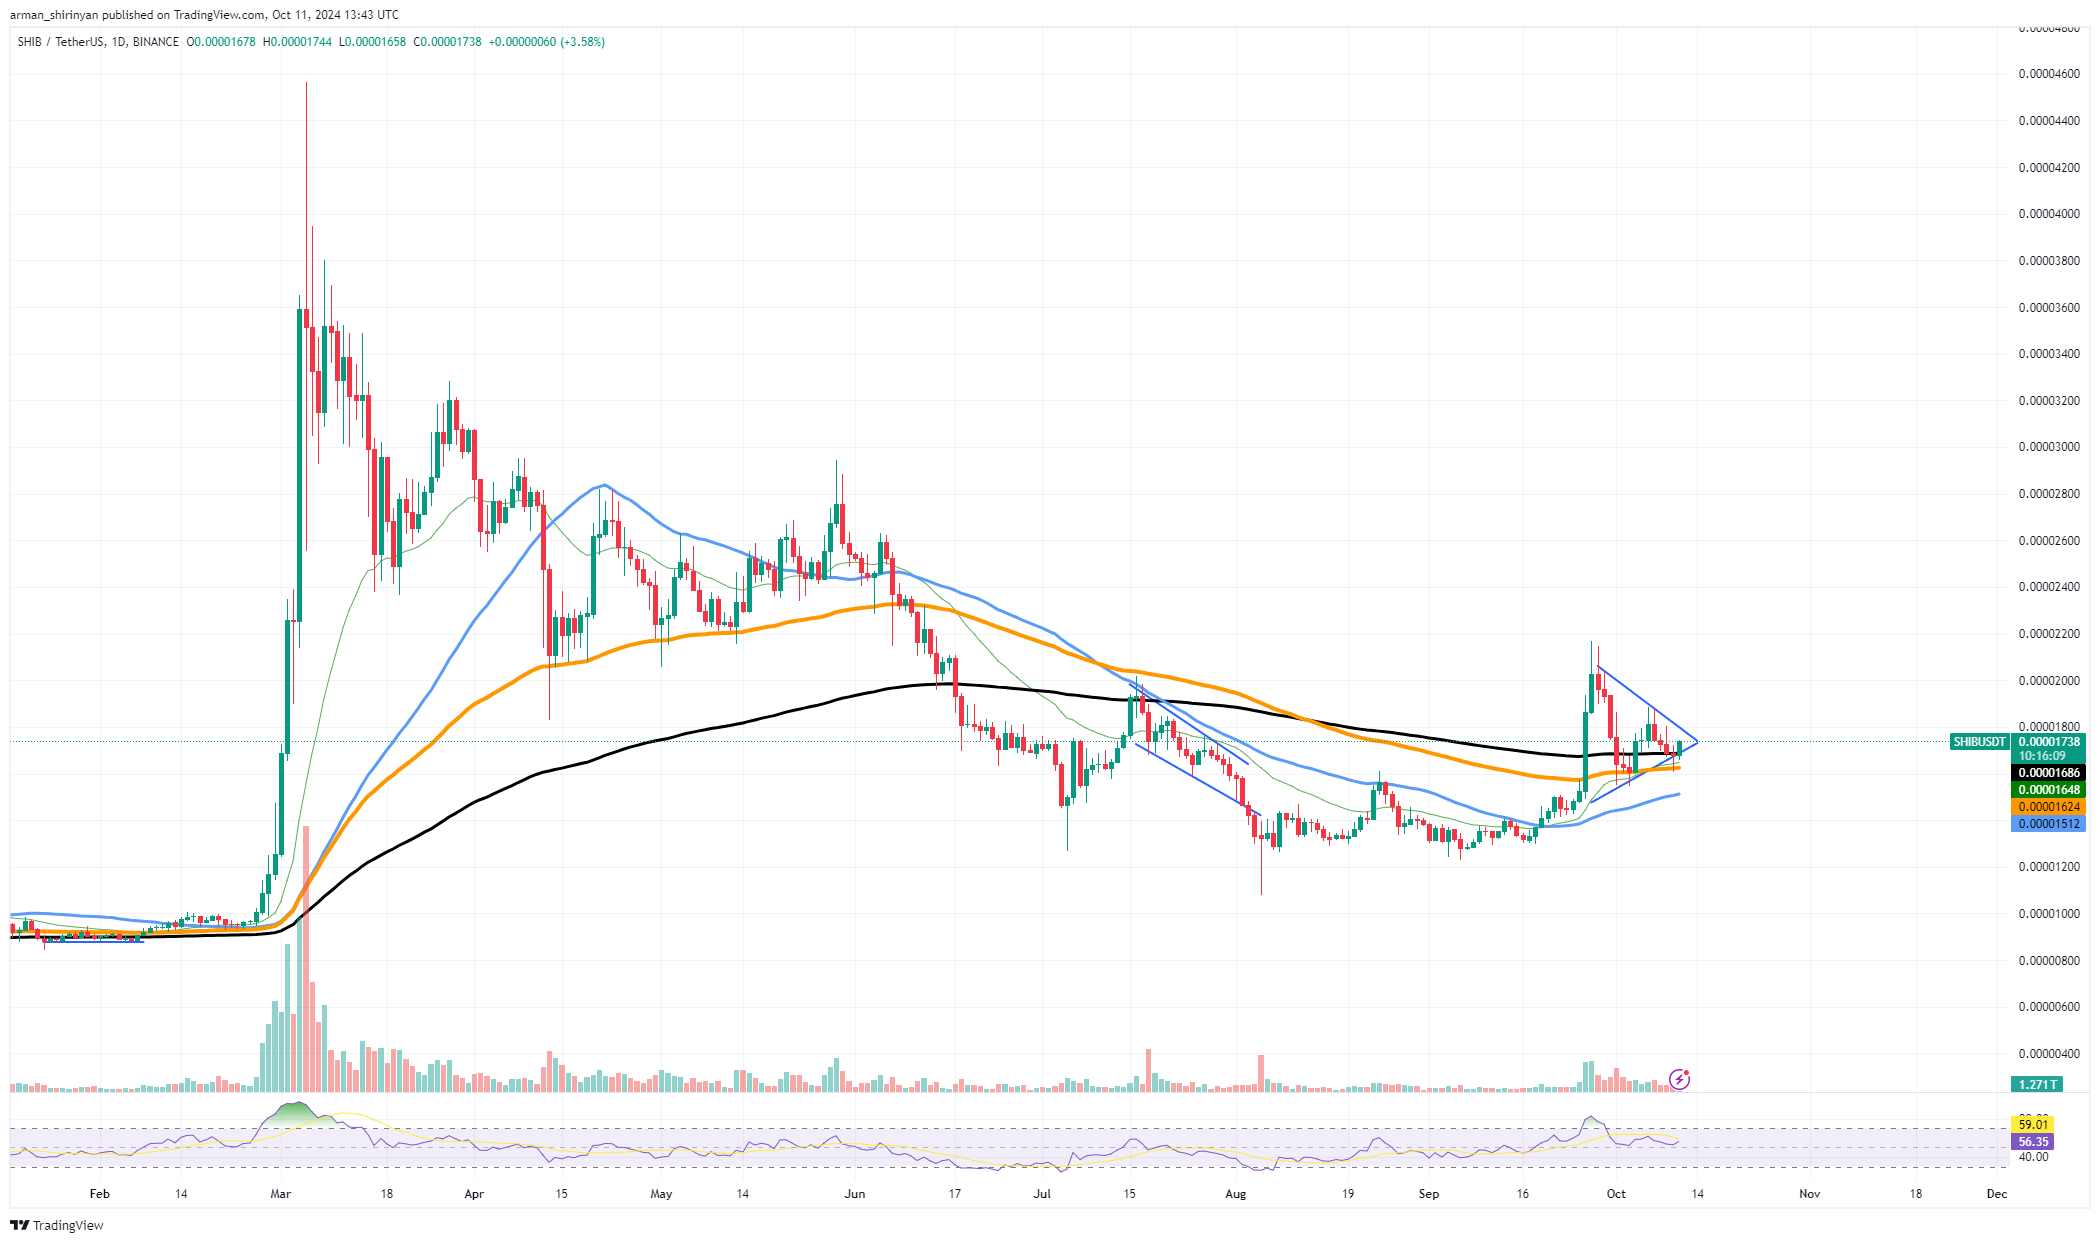
Shiba Inu (SHIB) approaches a crucial phase as a symmetrical triangle pattern on its chart signals a potential breakout. Historically, such patterns indicate increased volatility upon exiting the triangle's boundaries. SHIB traders anticipate a significant shift in momentum.
Currently, SHIB's price stabilizes within the triangle's narrowing range, typically preceding a significant move in either direction. When assets break out of these patterns, momentum often accelerates, leading to substantial price changes. SHIB may experience a major upswing if it breaks above key resistance levels.
 SHIB/USDT Chart by TradingView
Resistance levels to watch:
- $0.000018
- $0.000020
With growing bullish sentiment and supportive volume, SHIB could target higher price points as it did earlier this year.
Conversely, SHIB may retreat towards $0.000015 if it fails to sustain above support levels. A further decline may ensue if the price falls below this range.
XRP: Marginal Recovery
XRP has staged a modest recovery within the past 24 hours, potentially signaling a long-term reversal. This upward momentum offers hope for a rebound after a period of suppressed price movement over the last two weeks. However, significant hurdles remain.
XRP experienced a steep decline in late September, shedding substantial value within a short time frame. This sell-off instilled bearish sentiment, and there hasn't been sufficient buying pressure to reverse the downtrend. The lack of strong support from buyers raises concerns as the token seeks to regain traction.
Technically, XRP attempts to overcome the resistance level at $0.55, crucial for maintaining momentum. A successful breakout could pave the way for a move towards the $0.60 range. However, without significant bullish support, XRP may struggle to sustain beyond this point.
Holding above the $0.50 support level is essential to prevent further selling pressure and market capitulation. If this level breaks, price declines are likely to continue, indicating a potential bearish trend. While there has been a slight uptick, traders must exercise caution as the overall market sentiment remains volatile, and XRP lacks the robust buying interest necessary for a sustained recovery.
Dogecoin (DOGE): Consolidation with Reversal Signs
Dogecoin has been consolidating, but signals indicate an impending reversal. As the asset attempts to regain momentum, investors should pay attention to three key price levels.
$0.116 is the first critical level as it represents resistance that Dogecoin has faced in the past. A break above this mark could signal the start of a stronger uptrend. This level is also highlighted by an orange moving average, a significant technical indicator that has recently acted as a barrier for the asset. A clear break above $0.116 could pave the way for further gains.
$0.108 is the second level to watch, having acted as both support and resistance in recent months. This area holds significant importance as it marks the midpoint of Dogecoin's current trading range. Failure to hold this level could result in a move toward lower support, while a bounce from here would suggest growing bullish momentum.
Finally, the psychological level of $0.100 remains crucial. This round number coincides with the chart's black 200-day moving average, forming a significant psychological barrier. Maintaining above $0.100 would demonstrate strong support for Dogecoin and prevent further declines.


 DeFi Planet
 Crypto Daily™
 BlockchainReporter
 TheCoinrise Media
 DogeHome
 Crypto Daily™
 Crypto Daily™
 TheCoinrise Media


