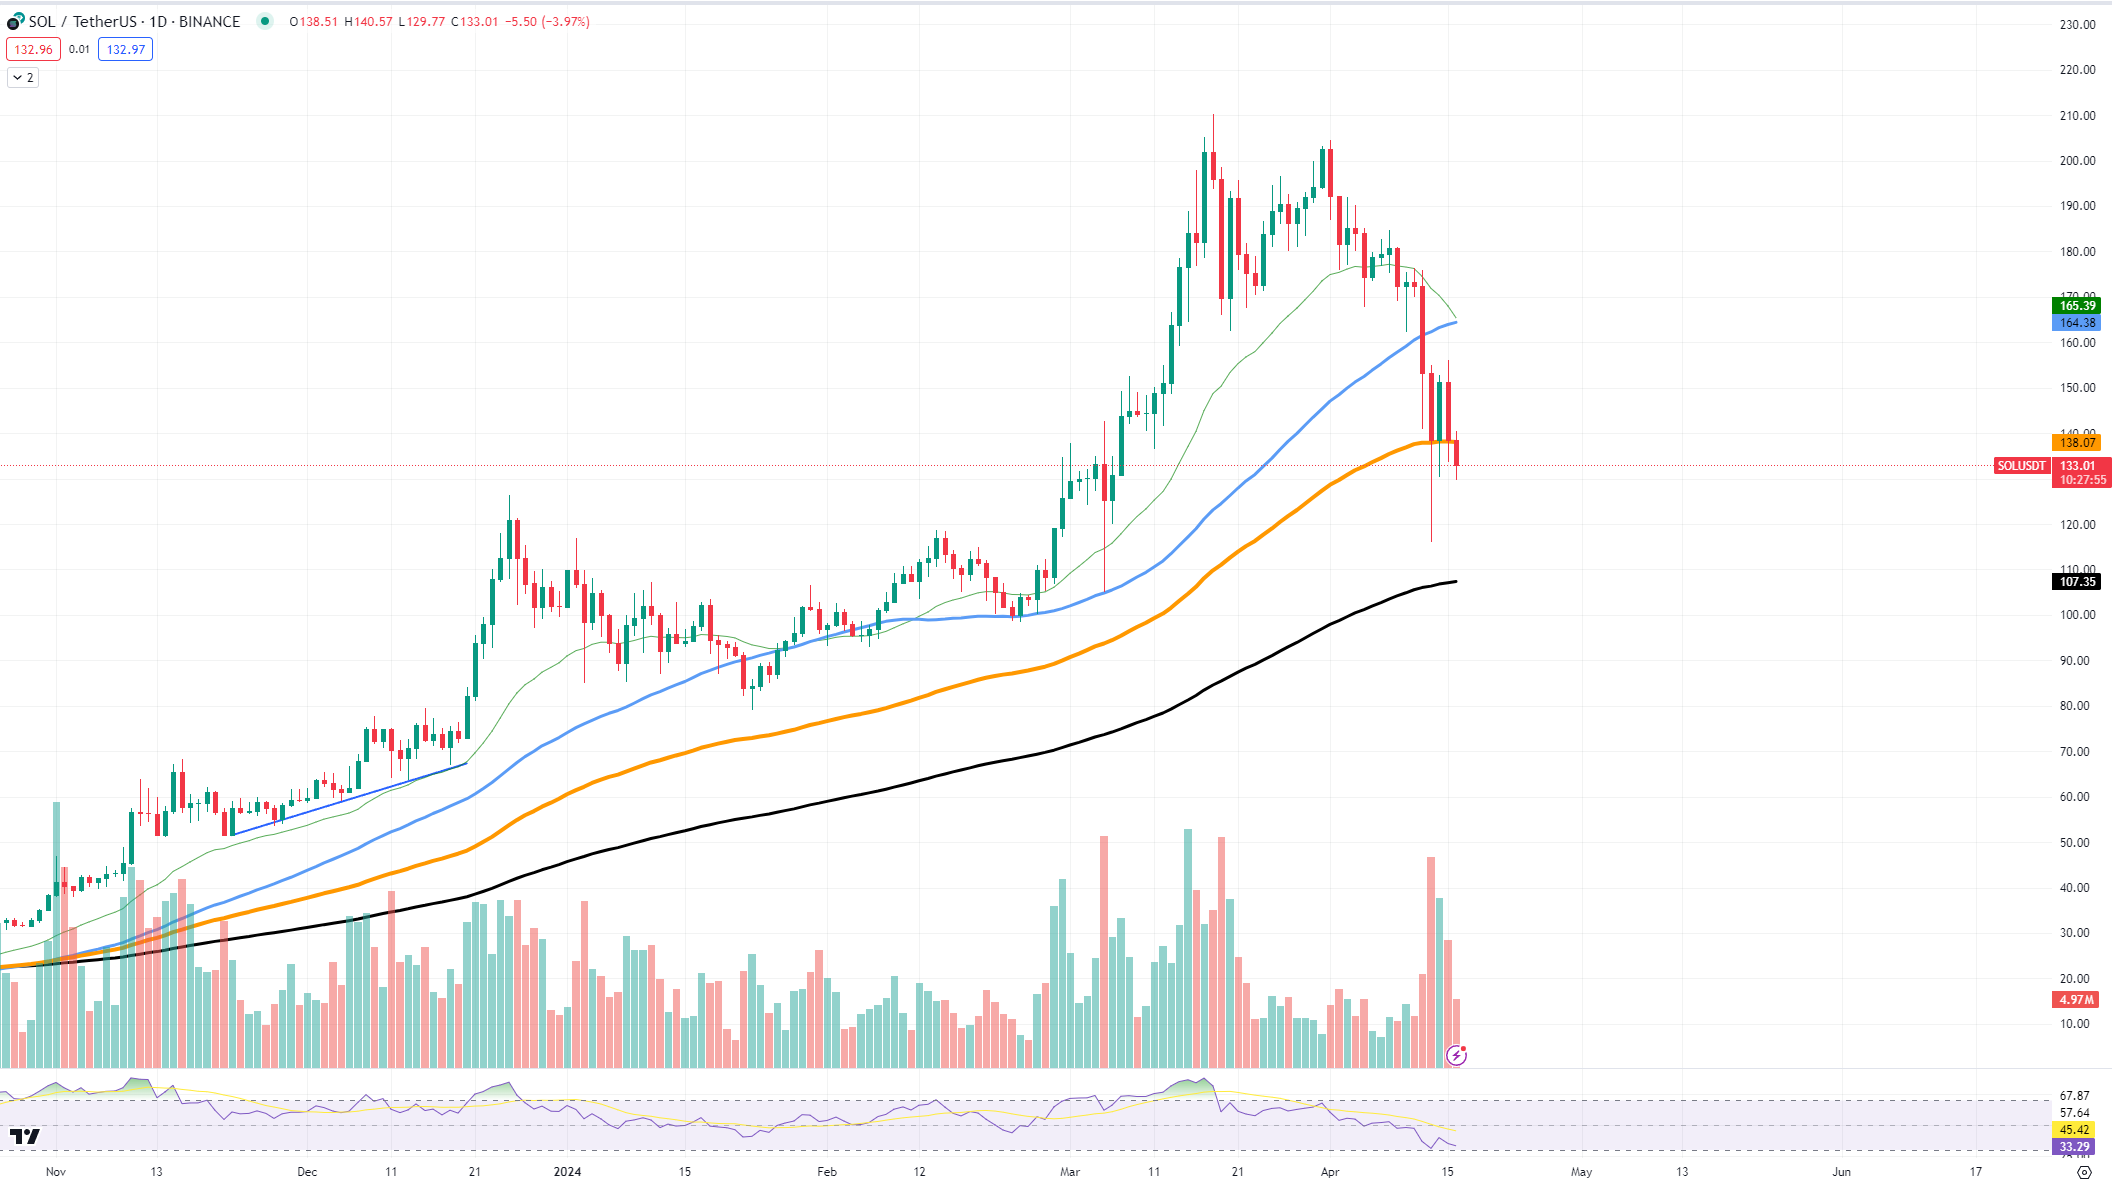
Solana is under scrutiny at the $140 mark. The price is hugging the 100-day Exponential Moving Average right now. It is a bit of a standoff, with Solana trying to hold its ground against downward pressure.
On Solana, there is not much buying action happening right now. This lack of enthusiasm can sometimes signal a potential drop in price, as it suggests traders might not be ready to jump in and push the price up.
 SOL/USDT Chart by TradingView
What is adding to the worry is that trading volume is increasing, but in this case, it might not be a good sign. Usually, a surge in volume means a lot of interest, but because the overall mood is bearish, it might just mean more people are selling their SOL.
Looking at the chart, we see that if Solana does not manage to stay above the current level, the next stop could be way down at around $107. On the upside, if Solana can rally and punch through the current resistance, the first goal would be reclaiming $165, a place where the price broke down before.
Bitcoin's calm before the storm
Bitcoin's price swings seem to have calmed down just as we are getting closer to the much-anticipated halving event. The price has only fluctuated by about $2,000, which is pretty tame for Bitcoin. This calm comes as the countdown to the halving ticks down.
Traders are being careful, unsure of what the halving will bring this time around. In the past, it has sparked big price jumps for Bitcoin, but it is not clear whether or not BTC will repeat itself.
Looking at the chart, Bitcoin's price is hovering around the $63,000 mark, with the recent price movement sandwiched between $58,638 and $67,014, which are seen as support and resistance levels, respectively.
The upcoming halving is causing a stir because it is when the reward for mining new Bitcoins is cut in half. This shake-up could potentially lead to less supply of new Bitcoins hitting the market. Usually, if demand stays the same but less is available, prices go up. That is the simple idea that has historically led to a rally in Bitcoin's price after previous halvings.
But this time, it is not just about halving. ETFs, institutional exposure, new technologies and other factors are greatly affecting the market and bringing us the potential to break the traditional four-year cycle.
Dogecoin's reversal
Dogecoin has been on a wild ride, and many are watching to see when its downward trend might turn around. A key level that could signal a possible reversal is at $0.139, right around the coin's 100-day Exponential Moving Average (EMA). But even more crucial is the $0.128 mark, which could act as a strong support level from which Dogecoin may bounce back.
The importance of the $0.128 level is not just a random guess — it is based on past price movements where Dogecoin has seen a lot of buying interest. Think of it as a floor that Dogecoin has bounced off of a few times before. If the price reaches this point again, buyers might step in, believing it is a good deal, potentially driving the price back up.
For those keeping an eye on Dogecoin, the current scenario presents a mix of caution and opportunity. The increase in trading volume recently suggests that there is significant activity around Dogecoin. However, with the overall market sentiment being cautious, this activity could mean more people are selling than buying right now.
Looking ahead, if Dogecoin manages to hold above $0.128 and starts climbing, it could first aim to get back over the $0.139 mark. Beyond that, reclaiming the $0.169 level would be the next target, which previously acted as a barrier that Dogecoin struggled to cross. But, should the price fail to hold at these key support points, the meme coin might have to brace for a further slide.


 CryptoNewsLand
 DogeHome
 CryptoNewsLand
 crypto.ro English
 CoinoMedia
 TheCoinrise
 Optimisus


