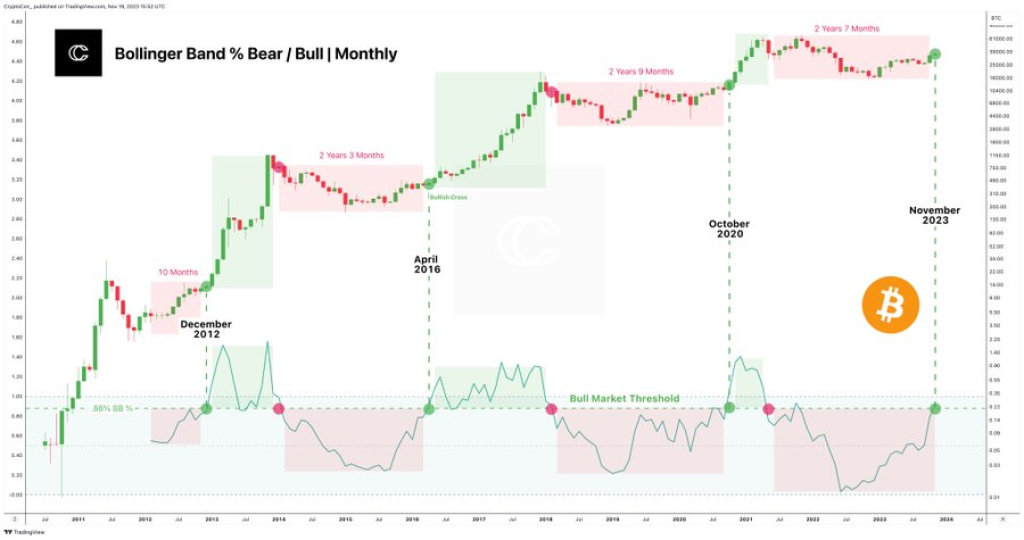
According to a recent post by CryptoCon, there is one indicator that makes it very simple to determine if Bitcoin is in a bull or bear market – the Bollinger Band %. As CryptoCon explains, this measurement looks at the percentage of time Bitcoin’s price is above the upper Bollinger Band.
Según una publicación reciente de CryptoCon, hay un indicador que hace que sea muy sencillo determinar si Bitcoin está en un mercado alcista o bajista: el% de la Banda de Bollinger. Como explica CryptoCon, esta medición analiza el porcentaje de tiempo que el precio de Bitcoin está por encima de la Banda de Bollinger superior.

The Power of Bollinger Bands
El poder de las bandas de Bollinger
Bollinger Bands are a type of statistical chart analysis that uses two bands plotted at two standard deviations above and below a simple moving average. When the price breaks above the upper band, it’s considered overbought, while a break below the lower band is seen as oversold. The percentage of time spent between the two bands indicates the overall trend.
Las Bandas de Bollinger son un tipo de análisis de gráficos estadísticos que utiliza dos bandas trazadas con dos desviaciones estándar por encima y por debajo de una media móvil simple. Cuando el precio supera la banda superior, se considera sobrecompra, mientras que una ruptura por debajo de la banda inferior se considera sobreventa. El porcentaje de tiempo transcurrido entre las dos bandas indica la tendencia general.
According to CryptoCon, Bitcoin spent just 2 years and 7 months below the .88% threshold, indicating a bearish trend. However, in October 2020, Bitcoin crossed back above this critical .88% mark, suggesting the start of a new bull market.
Según CryptoCon, Bitcoin pasó sólo 2 años y 7 meses por debajo del umbral del 0,88%, lo que indica una tendencia bajista. Sin embargo, en octubre de 2020, Bitcoin volvió a superar esta marca crítica del 0,88%, lo que sugiere el inicio de un nuevo mercado alcista.
Entering a New Bull Market
Entrar en un nuevo mercado alcista
CryptoCon states that this indicator “told us that the last cycle, black swan and all, was bearish until October 2020.” The .88% threshold represents the shortest amount of time Bitcoin’s price stayed above that level in previous cycles.
CryptoCon afirma que este indicador "nos dijo que el último ciclo, con el cisne negro y todo, fue bajista hasta octubre de 2020". El umbral del 0,88% representa el menor tiempo que el precio de Bitcoin permaneció por encima de ese nivel en ciclos anteriores.
Now that Bitcoin is back above .88%, CryptoCon believes “we have a long time to go with price action over the threshold this cycle.” He compares it to the 2015-2018 bull run and concludes “the cross is here, and we’re just getting started.”
Ahora que Bitcoin ha vuelto a estar por encima del 0,88%, CryptoCon cree que "nos queda mucho tiempo para que la acción del precio supere el umbral de este ciclo". Lo compara con la corrida alcista de 2015-2018 y concluye que "la cruz está aquí y apenas estamos comenzando".
Read also:
Lea también:
- The Most Accurate Price Band for Bitcoin Shows BTC’s Bull Surge Isn’t Over, Reveals Target Price
- Biggest Meme Coins, Dogecoin and Shiba Inu, Gear Up for Massive Bullish Rallies, but There’s a Catch
- Breaking: Investors Shift from TRON to Emerging Crypto Star for Promising Returns
La banda de precios más precisa para Bitcoin muestra que el aumento alcista de BTC no ha terminado y revela el precio objetivo
Las monedas Meme más grandes, Dogecoin y Shiba Inu, se preparan para repuntes alcistas masivos, pero hay un problema
Última hora: los inversores pasan de TRON a la criptoestrella emergente para obtener rendimientos prometedores
So in summary, this straightforward Bollinger Band metric makes it easy to visualize Bitcoin’s macro trends and indicates we’ve entered a new long-term bull market. CryptoCon sees plenty of room for growth based on historical patterns.
En resumen, esta sencilla métrica de la Banda de Bollinger facilita la visualización de las tendencias macroeconómicas de Bitcoin e indica que hemos entrado en un nuevo mercado alcista a largo plazo. CryptoCon ve mucho espacio para el crecimiento basado en patrones históricos.
We recommend eToro
Recomendamos Toro
El 74% de las cuentas minoristas de CFD pierden dinero.
Visite eToro ahora
Wide range of assets: cryptocurrencies alongside other investment products such as stocks and ETFs.
Copy trading: allows users to copy thetrades of leading traders, for free.
User-friendly: eToro’s web-based platform and mobile app are user-friendly and easy to navigate.
eToro offers staking for certain popular cryptocurrencies like ETH, ADA, XTZ etc.
Comunidad de usuarios activa y funciones sociales como fuentes de noticias y chats para monedas específicas disponibles para operar. Amplia gama de activos: criptomonedas junto con otros productos de inversión como acciones y ETF. Copy trading: permite a los usuarios copiar las operaciones de los principales traders de forma gratuita. Fácil de usar: la plataforma web y la aplicación móvil de eToro son fáciles de usar y de navegar. eToro ofrece apuestas para ciertas criptomonedas populares como ETH, ADA, XTZ, etc.
The post This BTC Indicator Makes It ‘Incredibly Easy’ to Know if Bitcoin Is in a Bull or Bear Market appeared first on CaptainAltcoin.
La publicación Este indicador BTC hace que sea "increíblemente fácil" saber si Bitcoin está en un mercado alcista o bajista apareció por primera vez en CaptainAltcoin.


 CFN
CFN Crypto News Land
 Crypto News Land
 Crypto Intelligence
 DeFi Planet
 TheCoinrise Media
 TheCoinrise Media
 DogeHome
 crypto.news


