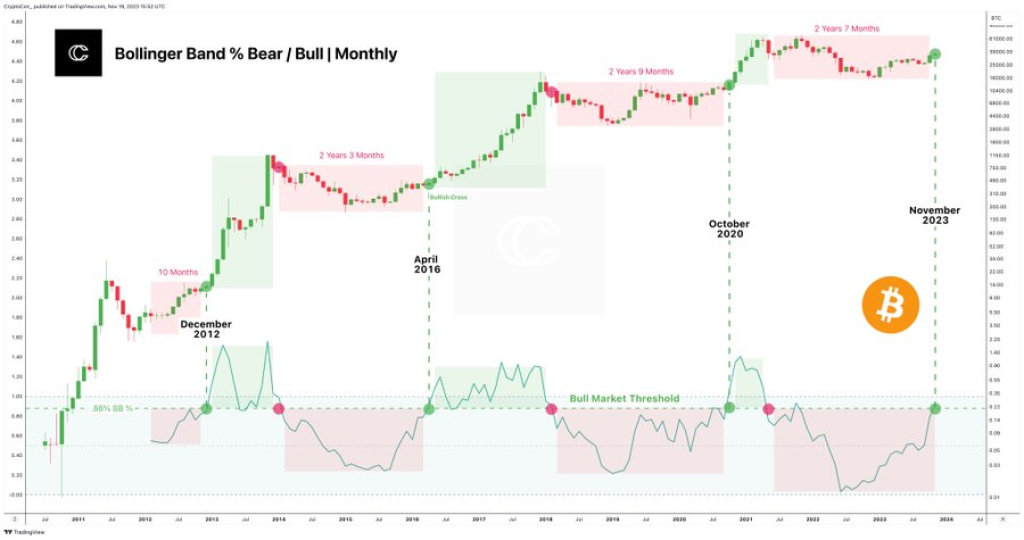
According to a recent post by CryptoCon, there is one indicator that makes it very simple to determine if Bitcoin is in a bull or bear market – the Bollinger Band %. As CryptoCon explains, this measurement looks at the percentage of time Bitcoin’s price is above the upper Bollinger Band.
CryptoCon의 최근 게시물에 따르면 비트코인이 강세장인지 약세장인지를 매우 간단하게 판단할 수 있는 지표가 하나 있습니다. 바로 볼린저 밴드(Bollinger Band) %입니다. CryptoCon이 설명했듯이 이 측정은 비트코인 가격이 볼린저 밴드 상단 위에 있는 시간의 비율을 살펴봅니다.

The Power of Bollinger Bands
볼린저 밴드의 힘
Bollinger Bands are a type of statistical chart analysis that uses two bands plotted at two standard deviations above and below a simple moving average. When the price breaks above the upper band, it’s considered overbought, while a break below the lower band is seen as oversold. The percentage of time spent between the two bands indicates the overall trend.
볼린저 밴드(Bollinger Bands)는 단순 이동 평균 위아래로 두 개의 표준 편차로 표시된 두 개의 밴드를 사용하는 일종의 통계 차트 분석입니다. 가격이 상단 밴드를 상향 돌파하면 과매수로 간주되고, 하단 밴드를 하향 돌파하면 과매도로 간주됩니다. 두 밴드 사이에 소요된 시간의 백분율은 전반적인 추세를 나타냅니다.
According to CryptoCon, Bitcoin spent just 2 years and 7 months below the .88% threshold, indicating a bearish trend. However, in October 2020, Bitcoin crossed back above this critical .88% mark, suggesting the start of a new bull market.
Entering a New Bull Market
CryptoCon states that this indicator “told us that the last cycle, black swan and all, was bearish until October 2020.” The .88% threshold represents the shortest amount of time Bitcoin’s price stayed above that level in previous cycles.
Now that Bitcoin is back above .88%, CryptoCon believes “we have a long time to go with price action over the threshold this cycle.” He compares it to the 2015-2018 bull run and concludes “the cross is here, and we’re just getting started.”
이제 비트코인이 .88% 이상으로 돌아왔으므로 CryptoCon은 "이번 주기에서 임계값을 넘는 가격 조치를 취하는 데 오랜 시간이 걸릴 것"이라고 믿습니다. 그는 이를 2015~2018년 강세장과 비교하며 "십자가는 여기에 있으며 우리는 이제 막 시작에 불과하다"고 결론지었습니다.
Read also:
- The Most Accurate Price Band for Bitcoin Shows BTC’s Bull Surge Isn’t Over, Reveals Target Price
- Biggest Meme Coins, Dogecoin and Shiba Inu, Gear Up for Massive Bullish Rallies, but There’s a Catch
- Breaking: Investors Shift from TRON to Emerging Crypto Star for Promising Returns
비트코인의 가장 정확한 가격 밴드는 BTC의 강세 급증이 끝나지 않았음을 보여주고 목표 가격을 공개합니다
가장 큰 Meme 코인인 Dogecoin과 Shiba Inu는 대규모 강세 랠리를 준비하고 있지만 문제가 있습니다
So in summary, this straightforward Bollinger Band metric makes it easy to visualize Bitcoin’s macro trends and indicates we’ve entered a new long-term bull market. CryptoCon sees plenty of room for growth based on historical patterns.
요약하면, 이 간단한 볼린저 밴드 지표를 사용하면 비트코인의 거시적 추세를 쉽게 시각화할 수 있으며 우리가 새로운 장기 강세장에 진입했음을 나타냅니다. CryptoCon은 역사적 패턴을 기반으로 성장할 여지가 충분하다고 봅니다.
We recommend eToro
소매 CFD 계좌의 74%가 손실을 입었습니다.
Wide range of assets: cryptocurrencies alongside other investment products such as stocks and ETFs.
Copy trading: allows users to copy thetrades of leading traders, for free.
User-friendly: eToro’s web-based platform and mobile app are user-friendly and easy to navigate.
eToro offers staking for certain popular cryptocurrencies like ETH, ADA, XTZ etc.
활동적인 사용자 커뮤니티 및 뉴스 피드, 거래 가능한 특정 코인에 대한 채팅과 같은 소셜 기능. 광범위한 자산: 주식 및 ETF와 같은 다른 투자 상품과 함께 암호화폐. 거래 복사: 사용자가 주요 거래자의 거래를 무료로 복사할 수 있습니다. 사용자 친화적: eToro의 웹 기반 플랫폼과 모바일 앱은 사용자 친화적이고 탐색이 쉽습니다. eToro는 ETH, ADA, XTZ 등과 같은 특정 인기 암호화폐에 대한 스테이킹을 제공합니다.
The post This BTC Indicator Makes It ‘Incredibly Easy’ to Know if Bitcoin Is in a Bull or Bear Market appeared first on CaptainAltcoin.
이 BTC 지표를 사용하면 비트코인이 강세장인지 약세장인지 알 수 있는 '놀랍도록 쉽게' 게시된 게시물이 CaptainAltcoin에 처음 등장했습니다.


 U_Today
 Thecoinrepublic.com
 DogeHome
 Optimisus
 Optimisus
 DeFi Planet
 Crypto Daily™
 BlockchainReporter
 TheCoinrise Media


