Markets have started on minor bullish activity today as seen by the slight increase in the global market cap which has risen by 0.5% over the last 24 hours to stand at $2.65T as of press time, while the trading volume also saw a 14% increase within the same period to stand at $120.5B.
Los mercados han comenzado hoy con una actividad alcista menor, como lo demuestra el ligero aumento en la capitalización del mercado global, que ha aumentado un 0,5 % en las últimas 24 horas hasta situarse en 2,65 billones de dólares al momento de esta edición, mientras que el volumen de operaciones también experimentó un aumento del 14 %. en el mismo período hasta situarse en 120.500 millones de dólares.
Bitcoin Price Review
Despite today’s minor bull activity, Bitcoin still faces consolidation in its market as it posts minimal gains in today’s session. The Bitcoin price is trading near the upper Bollinger Band, suggesting it’s in the higher price range relative to recent volatility. However, its movement towards a cross-over below the middle SMS suggests bearish activity on the crypto king.
Revisión del precio de Bitcoin A pesar de la menor actividad alcista de hoy, Bitcoin aún enfrenta una consolidación en su mercado, ya que registra ganancias mínimas en la sesión de hoy. El precio de Bitcoin cotiza cerca de la Banda de Bollinger superior, lo que sugiere que está en el rango de precios más alto en relación con la volatilidad reciente. Sin embargo, su movimiento hacia un cruce por debajo del SMS medio sugiere una actividad bajista en el rey de las criptomonedas.
This is supported by the Relative Strength Index indicator, which is currently moving south suggesting bearish activity on the token. The Bitcoin price stood at $69,901 as of press time representing a 0.72% drop from its previous 24-hour price.
Esto está respaldado por el indicador del índice de fuerza relativa, que actualmente se está moviendo hacia abajo, lo que sugiere una actividad bajista en el token. El precio de Bitcoin se situaba en 69.901 dólares al momento de esta edición, lo que representa una caída del 0,72% con respecto a su precio anterior de 24 horas.
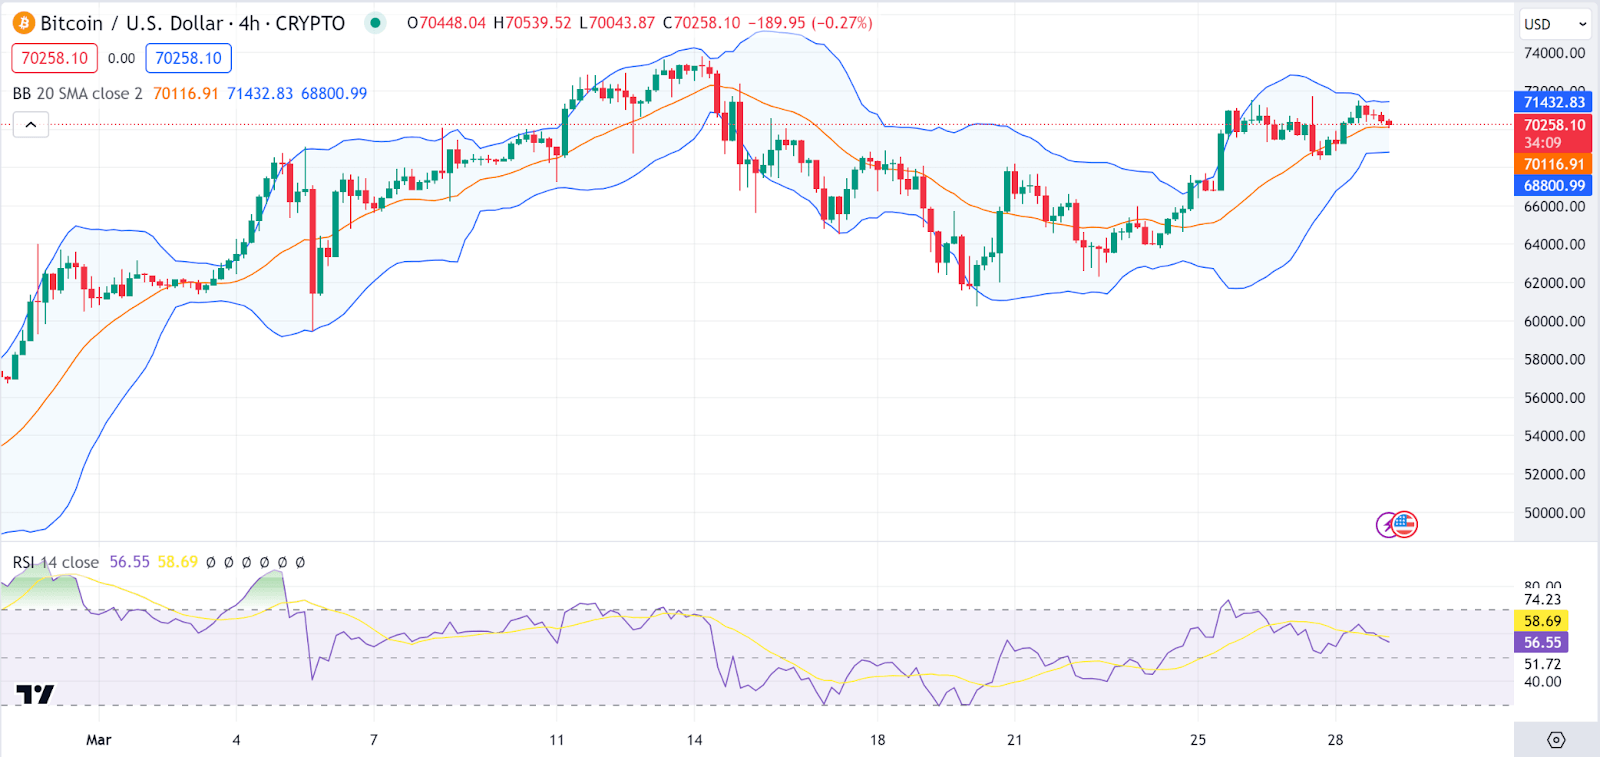 4-hour BTC/USD Chart | Source: TradingView
Gráfico BTC/USD de 4 horas | Fuente: TradingView
Ethereum Price Review
Ethereum (ETH) is facing bear activity today as evidenced by its price drop. However, despite the drop, we see the ‘Supertrend’ indicator applied, combining the average true range and the moving averages to determine the trend’s direction. The Ethereum price is now above the supertrend line, indicating a bullish trend in the price despite today’s drop.
Revisión del precio de Ethereum Ethereum (ETH) se enfrenta hoy a una actividad bajista, como lo demuestra la caída de su precio. Sin embargo, a pesar de la caída, vemos que se aplica el indicador "Supertendencia", que combina el rango verdadero promedio y las medias móviles para determinar la dirección de la tendencia. El precio de Ethereum ahora está por encima de la línea de supertendencia, lo que indica una tendencia alcista en el precio a pesar de la caída de hoy.
On the other hand, the MACD indicator also reverts towards the zero line, showing fading momentum from bearish to bullish. The Ethereum price stood at $3,521 as of press time representing a 1.3% drop over the last 24 hours.
Por otro lado, el indicador MACD también regresa hacia la línea cero, mostrando un impulso que se desvanece de bajista a alcista. El precio de Ethereum se situaba en 3.521 dólares al cierre de esta edición, lo que representa una caída del 1,3% en las últimas 24 horas.
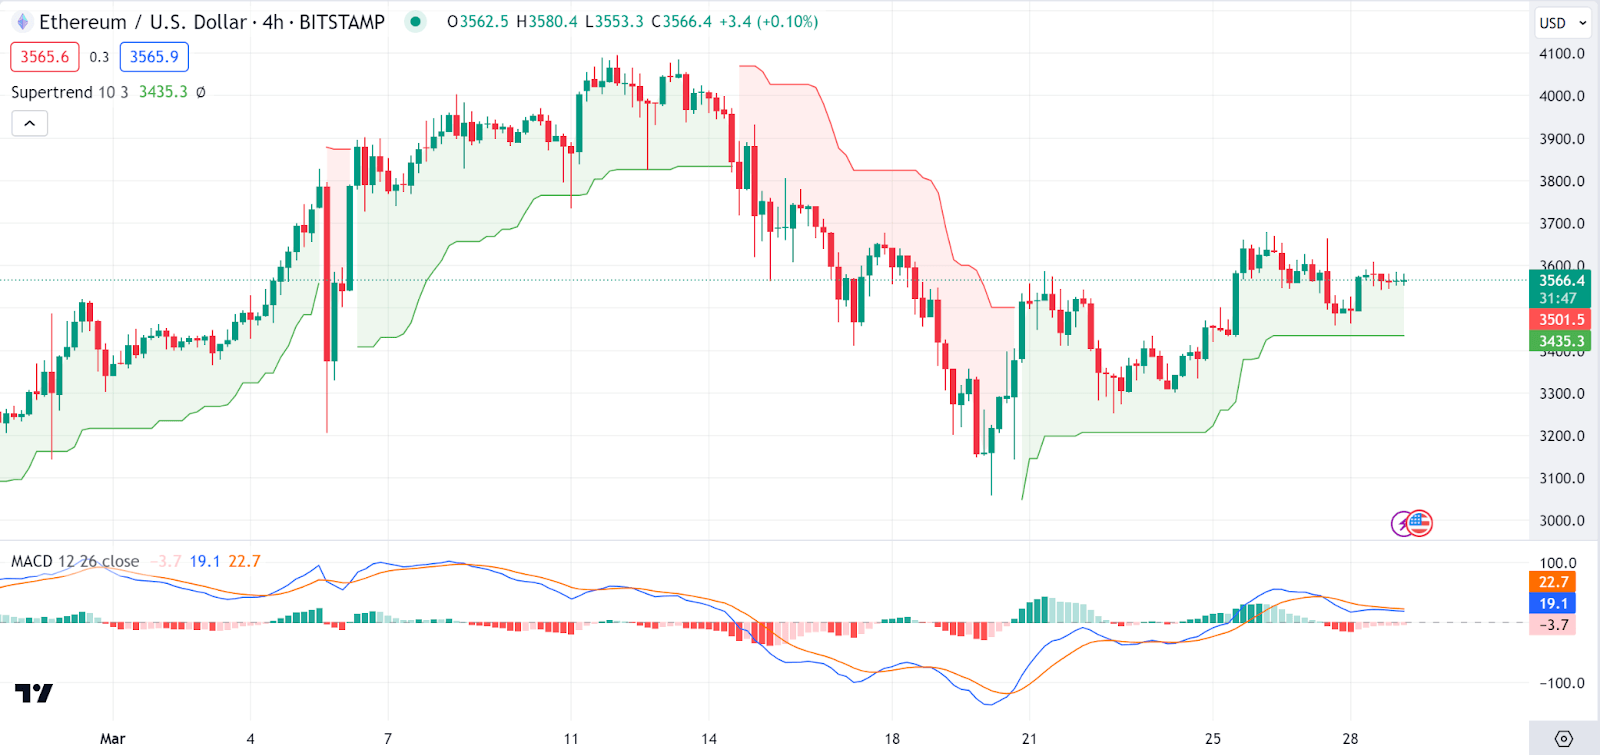 4-hour ETH/USD Chart | Source: TradingView
Gráfico ETH/USD de 4 horas | Fuente: TradingView
Dogwifhat Price Review
Dogwifhat (WIF) is today’s top gainer as the Solana meme coin again takes center stage. Looking at an in-depth analysis, we notice the Dogwifhat price has moved sharply above all the Alligator lines (jaw, teeth, and lips), indicating a solid uptrend.
Revisión del precio de Dogwifhat Dogwifhat (WIF) es el principal ganador de hoy, ya que la moneda meme Solana vuelve a ocupar un lugar central. Al observar un análisis en profundidad, notamos que el precio de Dogwifhat se ha movido bruscamente por encima de todas las líneas de cocodrilo (mandíbula, dientes y labios), lo que indica una sólida tendencia alcista.
On the other hand, the Awesome Oscillator, an indicator used in gauging trends, is changing from red to green, indicating a change in momentum from bearish to bullish. The Dogwifhat price stood at $3.69 as of press time representing a 19.27% pump over the last 24 hours.
Por otro lado, el Awesome Oscillator, un indicador utilizado para medir tendencias, está cambiando de rojo a verde, lo que indica un cambio en el impulso de bajista a alcista. El precio de Dogwifhat se situaba en 3,69 dólares al cierre de esta edición, lo que representa un aumento del 19,27% en las últimas 24 horas.
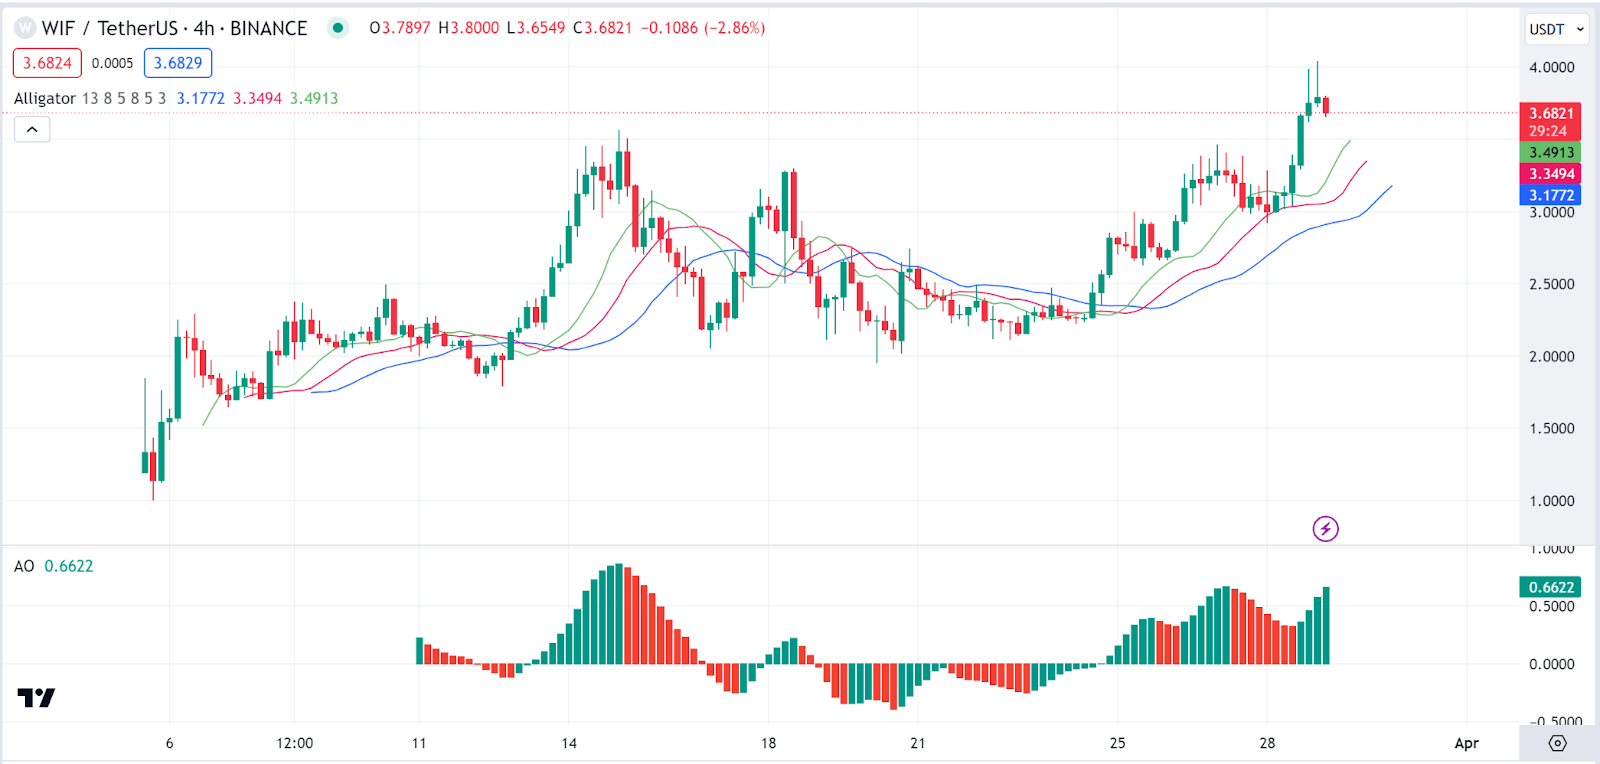 4-hour WIF/USDT Chart | Source: TradingView
Gráfico WIF/USDT de 4 horas | Fuente: TradingView
BitTorrent Price Review
BitTorrent (BTT) is the second top gainer in today’s session as it also posted notable gains. Looking at an in-depth analysis, the BitTorrent price is at the upper end of the pitchfork, which could be seen as an area of resistance.
Revisión de precios de BitTorrentBitTorrent (BTT) es el segundo mayor ganador en la sesión de hoy, ya que también registró ganancias notables. Si analizamos en profundidad, el precio de BitTorrent se encuentra en el extremo superior de la horquilla, lo que podría verse como un área de resistencia.
The Average Average Directional Index (ADX) is at 28, showing a strong trend on the BitTorrent price. The BitTorrent price stood at $0.000001635 as of press time representing a 8.2% pump over the last 24 hours.
El índice direccional promedio (ADX) está en 28, lo que muestra una fuerte tendencia en el precio de BitTorrent. El precio de BitTorrent se situaba en 0,000001635 dólares al momento de esta edición, lo que representa un aumento del 8,2% en las últimas 24 horas.
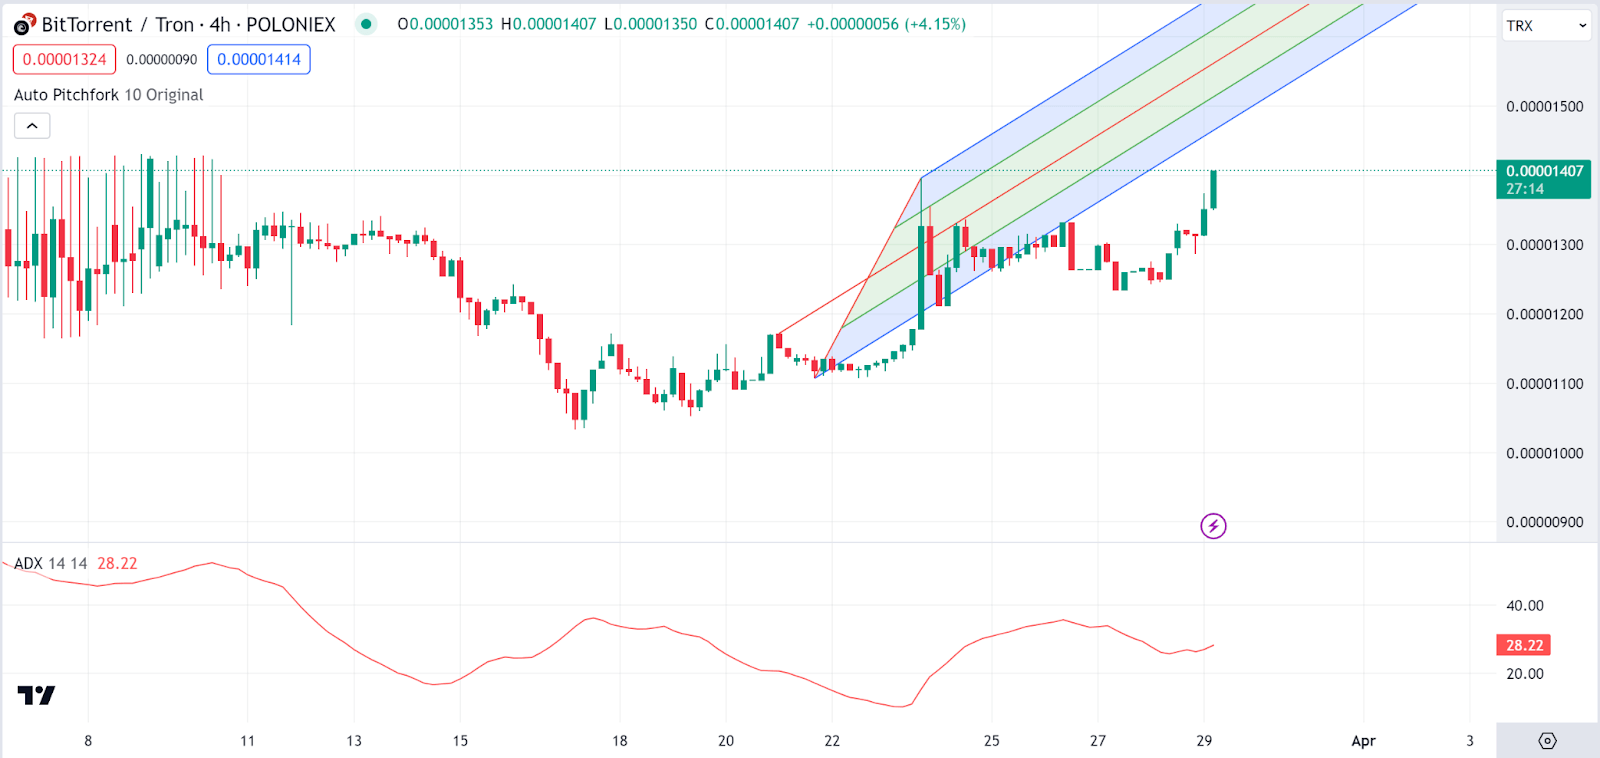 4-hour BTT/TRX Chart | Source: TradingView
Gráfico BTT/TRX de 4 horas | Fuente: TradingView
Dogecoin Price Review
As shown by its rise today, Dogecoin (DOGE) is today’s third top gainer. The
Revisión del precio de Dogecoin Como lo demuestra su aumento hoy, Dogecoin (DOGE) es el tercer mayor ganador de hoy. El
- DOGE$0.21

price is above the Ichimoku cloud, which is bullish, and it is also above the baseline (kijun-sen) and the conversion line (tenkan-sen), reinforcing the bullish sentiment.
El precio de DOGE$ 0,21 está por encima de la nube Ichimoku, que es alcista, y también está por encima de la línea de base (kijun-sen) y la línea de conversión (tenkan-sen), lo que refuerza el sentimiento alcista.
The MACD indicator is however headed back towards the red zone, suggesting fading bullishness on the meme coin leaving out the possibility of a correction. The Dogecoin price stood at $0.216 as of press time representing a 10% pump over the last 24 hours.
Sin embargo, el indicador MACD se dirige nuevamente hacia la zona roja, lo que sugiere que el optimismo en la moneda meme se desvanece y deja fuera la posibilidad de una corrección. El precio de Dogecoin se situaba en 0,216 dólares al momento de esta edición, lo que representa un aumento del 10% en las últimas 24 horas.
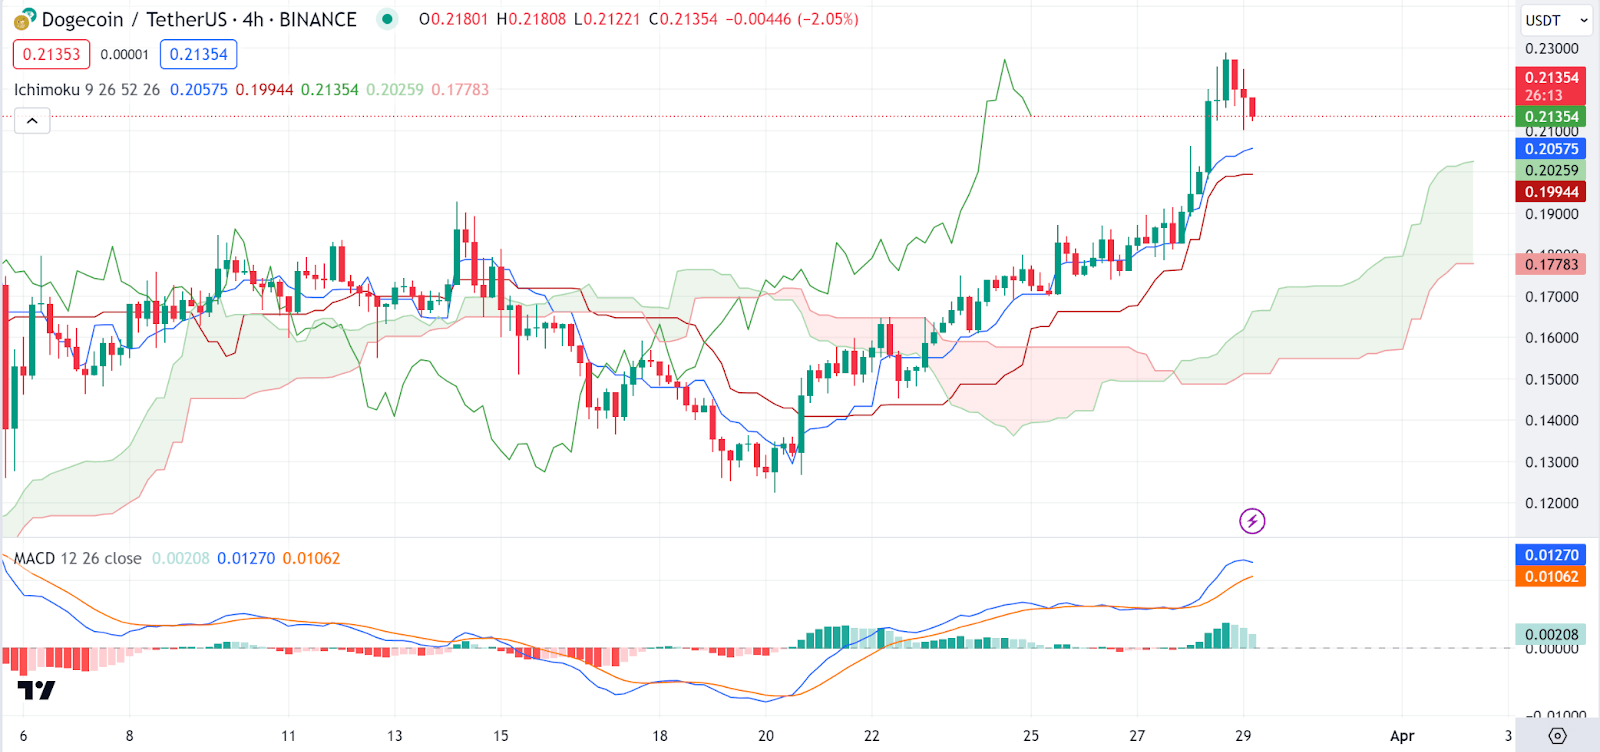 4-hour DOGE/USDT Chart | Source: TradingView
Gráfico DOGE/USDT de 4 horas | Fuente: TradingView


 BlockchainReporter
 Crypto Intelligence
 DogeHome
 Cointelegraph
 Crypto Intelligence
 DogeHome
 Crypto News Land
 Crypto Daily™
 Crypto Intelligence


