Markets have started on minor bullish activity today as seen by the slight increase in the global market cap which has risen by 0.5% over the last 24 hours to stand at $2.65T as of press time, while the trading volume also saw a 14% increase within the same period to stand at $120.5B.
世界時価総額が過去24時間で0.5%上昇し、本稿執筆時点で2.65兆ドルとなっていることからも分かるように、今日の市場は若干の強気の動きで始まり、取引高も14%増加した。同じ期間内に 1,205 億ドルに達します。
Bitcoin Price Review
Despite today’s minor bull activity, Bitcoin still faces consolidation in its market as it posts minimal gains in today’s session. The Bitcoin price is trading near the upper Bollinger Band, suggesting it’s in the higher price range relative to recent volatility. However, its movement towards a cross-over below the middle SMS suggests bearish activity on the crypto king.
ビットコイン価格のレビュー今日の小規模な強気の動きにもかかわらず、ビットコインは今日のセッションで最小限の利益を記録しており、依然として市場での統合に直面しています。ビットコイン価格はボリンジャーバンドの上部付近で取引されており、最近のボラティリティと比較してより高い価格帯にあることを示唆しています。しかし、中央のSMSを下回るクロスオーバーに向けた動きは、暗号通貨王に対する弱気の活動を示唆しています。
This is supported by the Relative Strength Index indicator, which is currently moving south suggesting bearish activity on the token. The Bitcoin price stood at $69,901 as of press time representing a 0.72% drop from its previous 24-hour price.
これは相対強度指数指標によって裏付けられており、この指標は現在南に移動しており、トークンの弱気活動を示唆しています。本稿執筆時点でのビットコイン価格は69,901ドルで、以前の24時間価格から0.72%下落した。
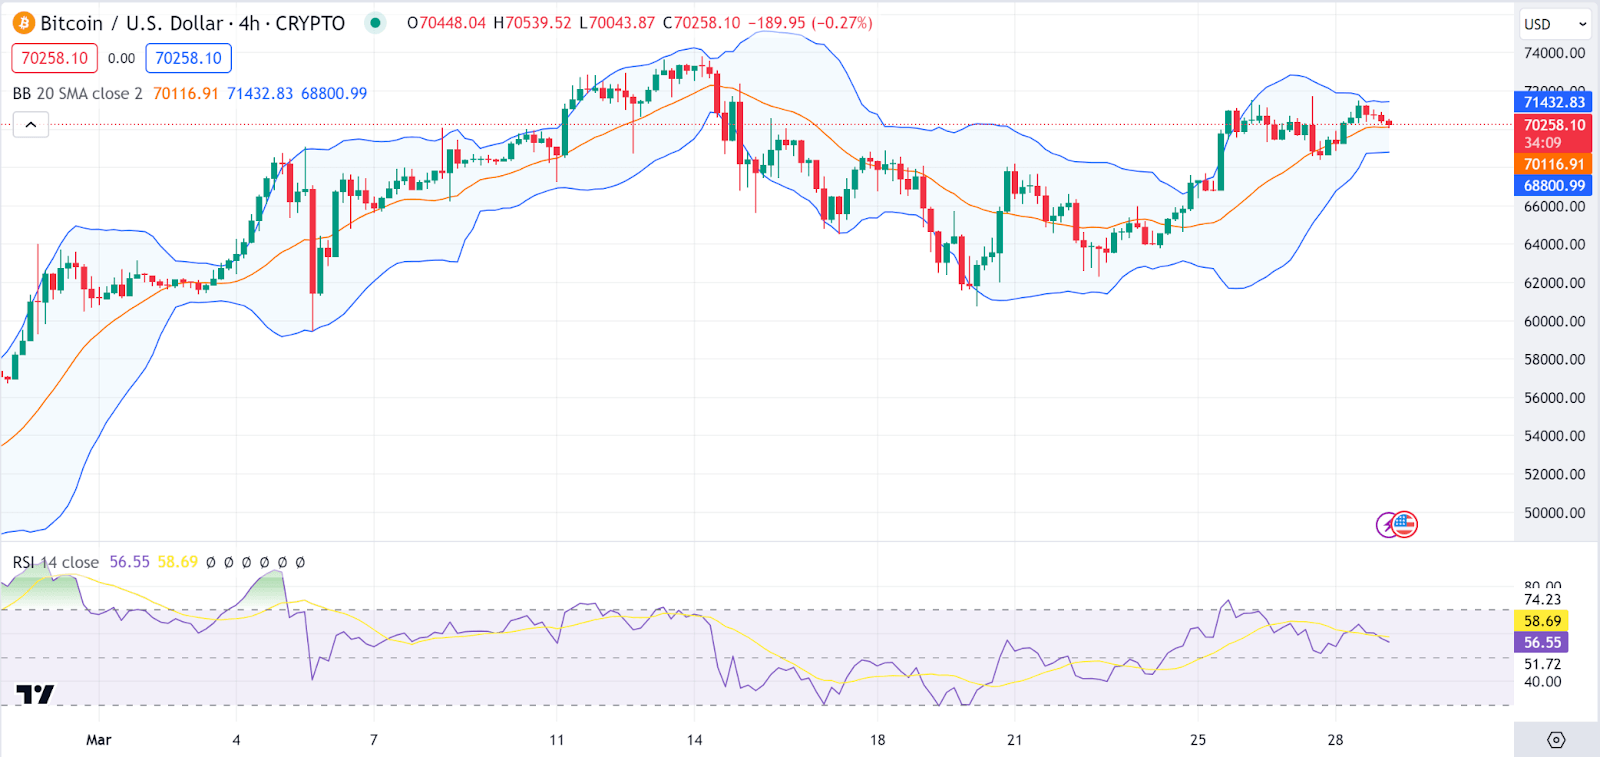 4-hour BTC/USD Chart | Source: TradingView
4時間BTC/USDチャート |出典: TradingView
Ethereum Price Review
Ethereum (ETH) is facing bear activity today as evidenced by its price drop. However, despite the drop, we see the ‘Supertrend’ indicator applied, combining the average true range and the moving averages to determine the trend’s direction. The Ethereum price is now above the supertrend line, indicating a bullish trend in the price despite today’s drop.
イーサリアム価格レビューイーサリアム (ETH) は、価格下落によって明らかなように、今日弱気の動きに直面しています。ただし、下落にもかかわらず、「スーパートレンド」インジケーターが適用され、平均真の範囲と移動平均を組み合わせてトレンドの方向を決定していることがわかります。イーサリアム価格は現在スーパートレンドラインを上回っており、今日の下落にもかかわらず価格が強気傾向にあることを示しています。
On the other hand, the MACD indicator also reverts towards the zero line, showing fading momentum from bearish to bullish. The Ethereum price stood at $3,521 as of press time representing a 1.3% drop over the last 24 hours.
一方で、MACD指標もゼロラインに向かって戻り、弱気から強気への勢いが弱まっていることを示しています。イーサリアムの価格は記事執筆時点で 3,521 ドルで、過去 24 時間で 1.3% 下落しました。
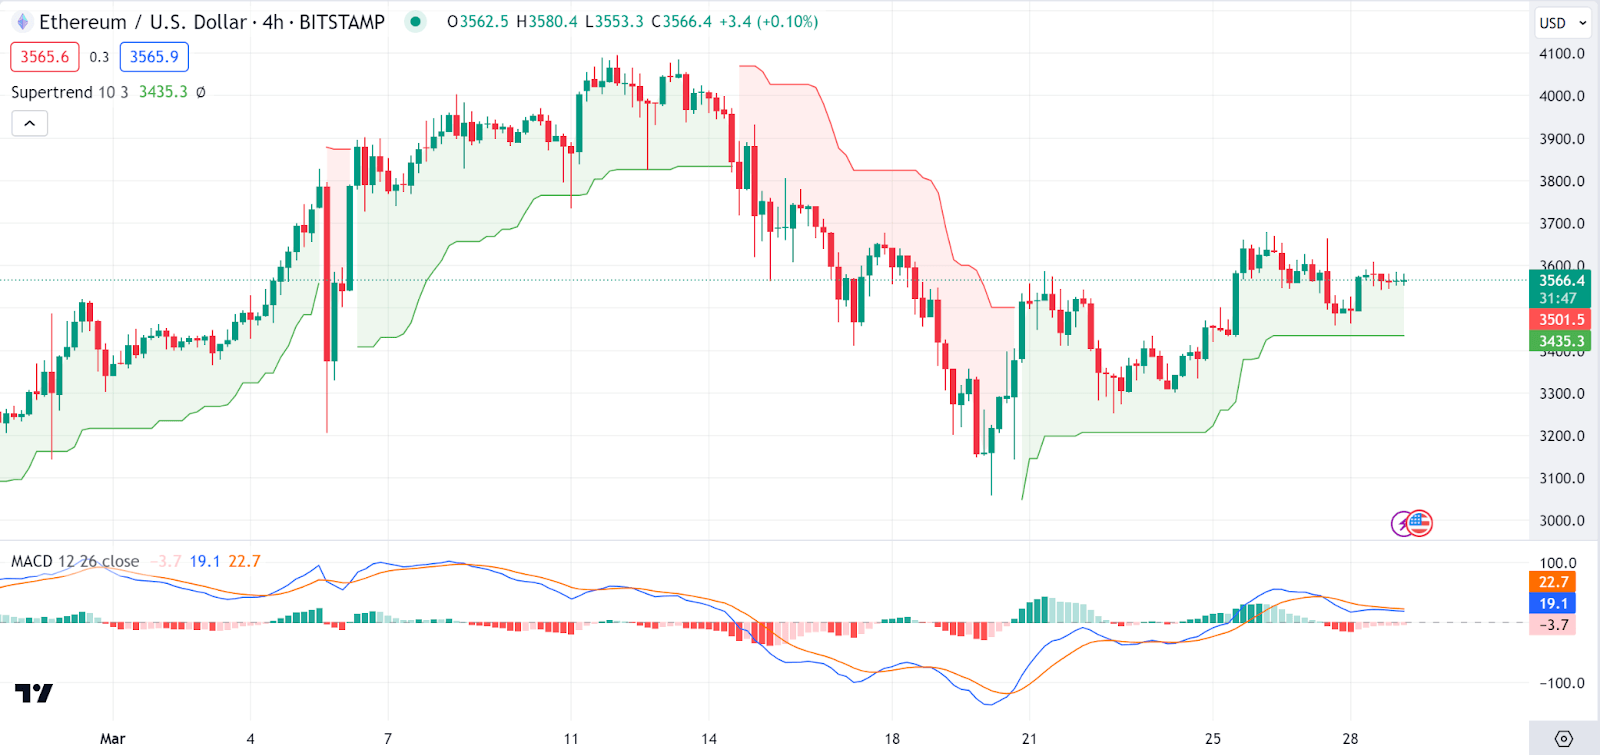 4-hour ETH/USD Chart | Source: TradingView
4時間足ETH/USDチャート |出典: TradingView
Dogwifhat Price Review
Dogwifhat (WIF) is today’s top gainer as the Solana meme coin again takes center stage. Looking at an in-depth analysis, we notice the Dogwifhat price has moved sharply above all the Alligator lines (jaw, teeth, and lips), indicating a solid uptrend.
Dogwifhat 価格レビューSolana ミームコインが再び表舞台に立つ中、Dogwifhat (WIF) が今日のトップの値上がり者です。詳細な分析を見ると、ドグウィファットの価格がすべてのアリゲーターライン(顎、歯、唇)を上回って急激に推移しており、堅実な上昇傾向を示していることがわかります。
On the other hand, the Awesome Oscillator, an indicator used in gauging trends, is changing from red to green, indicating a change in momentum from bearish to bullish. The Dogwifhat price stood at $3.69 as of press time representing a 19.27% pump over the last 24 hours.
一方、トレンドの測定に使用される指標であるオーサム オシレーターは赤から緑に変化しており、弱気から強気への勢いの変化を示しています。 Dogwifhat の価格は記事執筆時点で 3.69 ドルで、過去 24 時間で 19.27% 上昇しました。
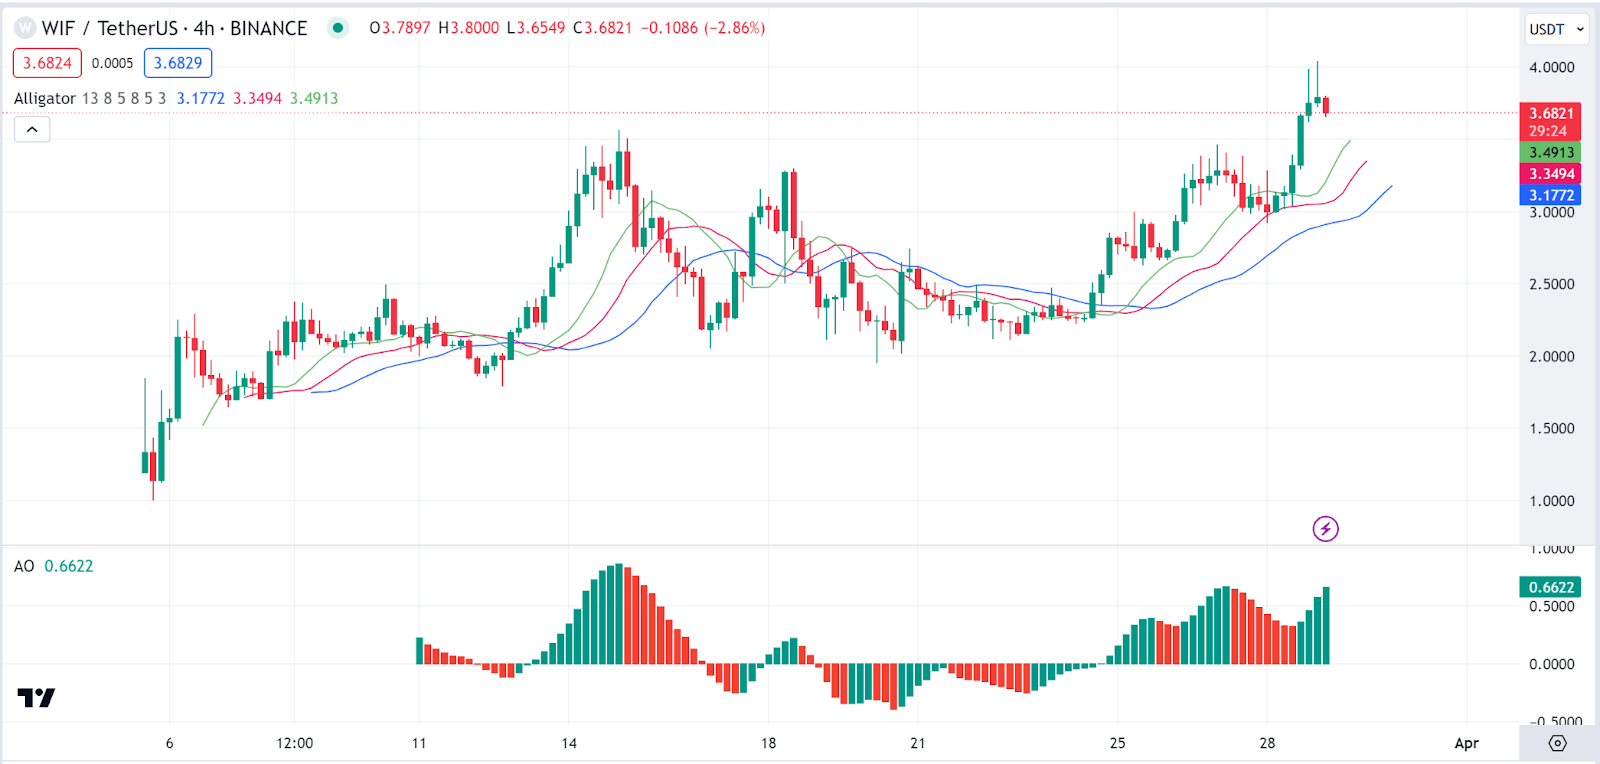 4-hour WIF/USDT Chart | Source: TradingView
4時間足WIF/USDTチャート |出典: TradingView
BitTorrent Price Review
BitTorrent (BTT) is the second top gainer in today’s session as it also posted notable gains. Looking at an in-depth analysis, the BitTorrent price is at the upper end of the pitchfork, which could be seen as an area of resistance.
BitTorrent 価格レビューBitTorrent (BTT) も注目すべき上昇を記録し、今日のセッションで 2 番目に上昇率の高い銘柄です。詳細な分析を見ると、BitTorrent の価格は熊手の上限にあり、抵抗領域と見なすことができます。
The Average Average Directional Index (ADX) is at 28, showing a strong trend on the BitTorrent price. The BitTorrent price stood at $0.000001635 as of press time representing a 8.2% pump over the last 24 hours.
平均方向性指数 (ADX) は 28 で、BitTorrent 価格の強い傾向を示しています。 BitTorrent の価格は記事執筆時点で 0.000001635 ドルで、過去 24 時間で 8.2% 上昇しました。
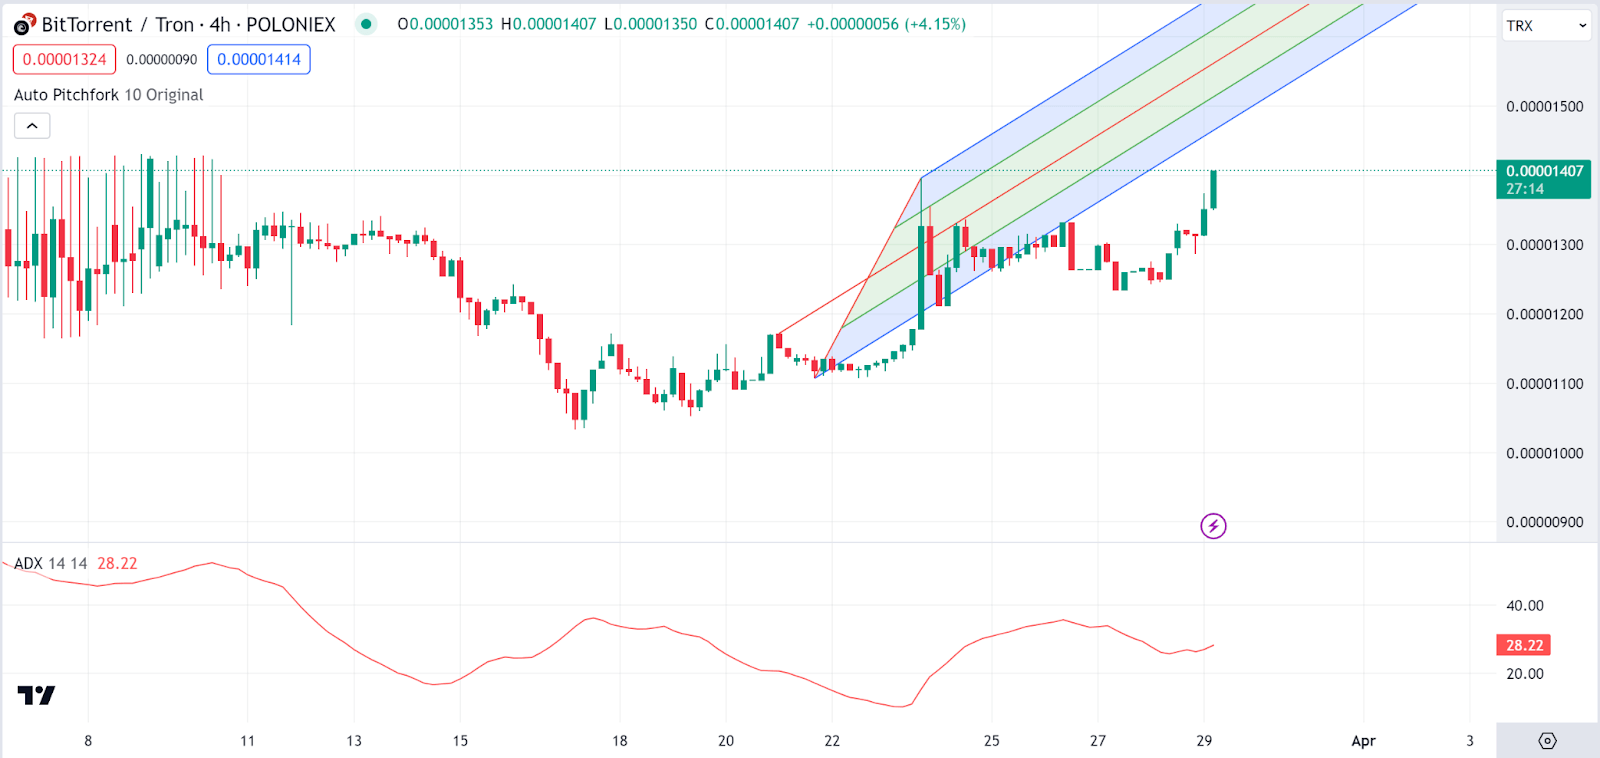 4-hour BTT/TRX Chart | Source: TradingView
4時間BTT/TRXチャート |出典: TradingView
Dogecoin Price Review
As shown by its rise today, Dogecoin (DOGE) is today’s third top gainer. The
ドージコイン価格のレビュー今日の上昇によって示されているように、ドージコイン (DOGE) は今日の 3 番目のトップ上昇者です。の
- DOGE$0.21

price is above the Ichimoku cloud, which is bullish, and it is also above the baseline (kijun-sen) and the conversion line (tenkan-sen), reinforcing the bullish sentiment.
DOGE$0.21価格は強気の一目雲を上回っており、基準線(基準線)と転換線(転換線)も上にあり、強気の感情を強めています。
The MACD indicator is however headed back towards the red zone, suggesting fading bullishness on the meme coin leaving out the possibility of a correction. The Dogecoin price stood at $0.216 as of press time representing a 10% pump over the last 24 hours.
しかし、MACD指標はレッドゾーンに向かって戻っており、ミームコインの強気の傾向が薄れて調整の可能性を排除していることを示唆しています。ドージコインの価格は記事執筆時点で0.216ドルで、過去24時間で10%上昇したことを表している。
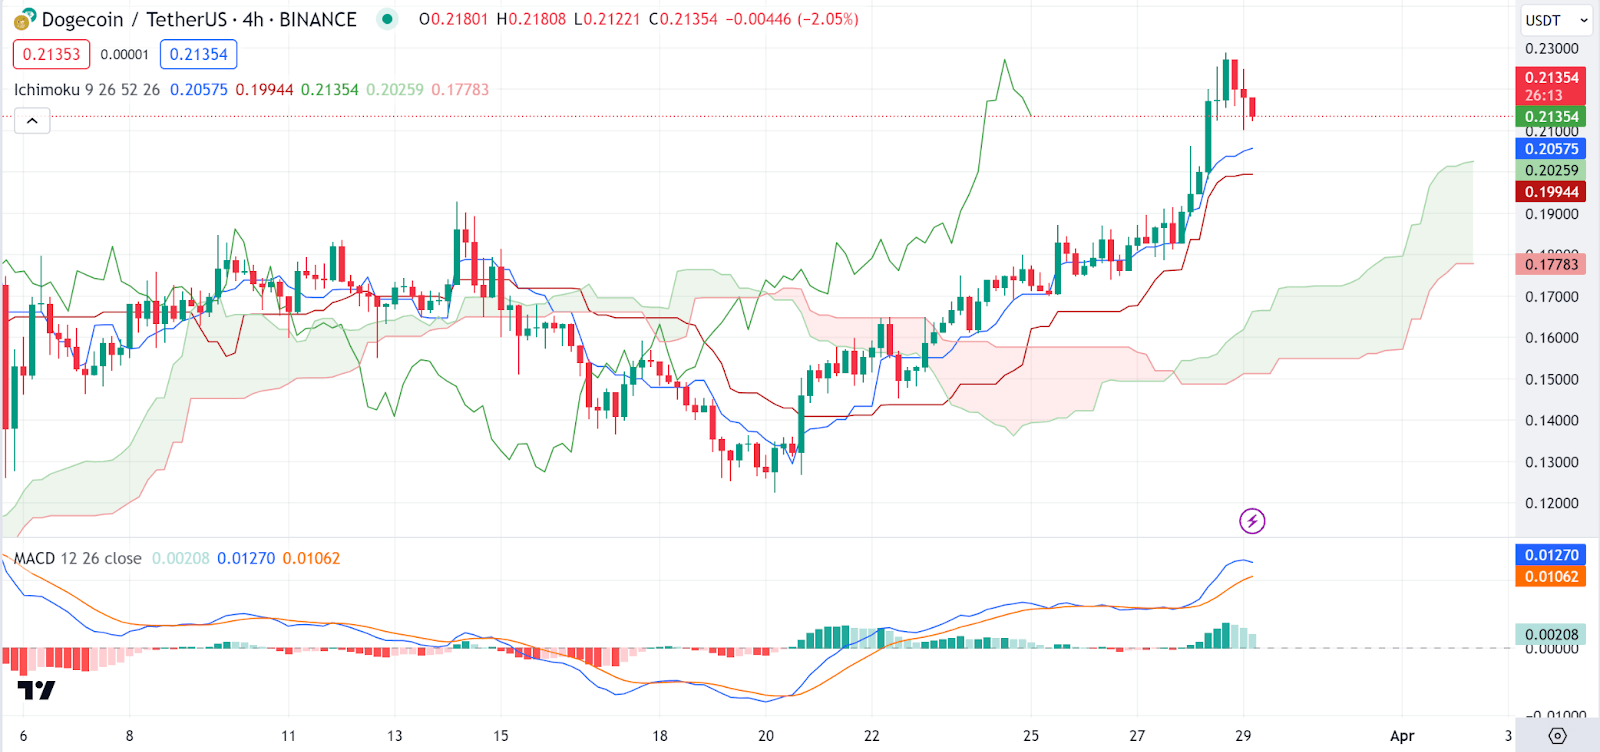 4-hour DOGE/USDT Chart | Source: TradingView
4時間足DOGE/USDTチャート |出典: TradingView


 DogeHome
 Coincu
 Coin Edition
 Coin_Gabbar
 Coincu
 BlockchainReporter
 CoinPedia News


