Dogecoin corrected gains and tested the $0.150 zone against the US Dollar. DOGE is now forming a base and might start a fresh increase above $0.1520.
Dogecoin corrigió las ganancias y probó la zona de $ 0,150 frente al dólar estadounidense. DOGE ahora está formando una base y podría iniciar un nuevo aumento por encima de 0,1520 dólares.
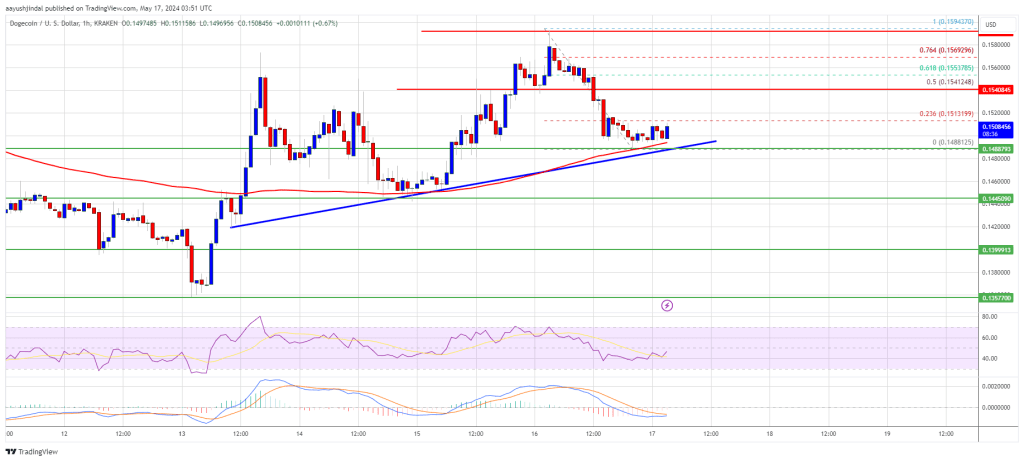
DOGE price jumped toward $0.160 before correcting gains. The price is trading above the $0.150 level and the 100-hourly simple moving average. There is a key bullish trend line forming with support at $0.1485 on the hourly chart of the DOGE/USD pair (data source from Kraken). The price must settle above $0.1540 to move into a positive zone and start a fresh surge.
El precio de DOGE saltó a 0,160 dólares antes de corregir las ganancias. El precio se cotiza por encima del nivel de $ 0,150 y del promedio móvil simple de 100 horas. Se está formando una línea de tendencia alcista clave con soporte en $ 0,1485 en el gráfico horario del par DOGE/USD (fuente de datos de Kraken). El precio debe estabilizarse por encima de USD 0,1540 para pasar a una zona positiva y comenzar un nuevo aumento.
Dogecoin Price Holds Support
El precio de Dogecoin mantiene el soporte
After a steady increase, Dogecoin price faced resistance near the $0.160 zone. A high was formed at $0.1594 before DOGE started a downside correction like Bitcoin and Ethereum. There was a drop below the $0.1540 support zone. A low was formed at $0.1488 and DOGE is now consolidating for the next move.
Después de un aumento constante, el precio de Dogecoin enfrentó una resistencia cerca de la zona de $ 0,160. Se formó un máximo de $ 0,1594 antes de que DOGE comenzara una corrección a la baja como Bitcoin y Ethereum. Hubo una caída por debajo de la zona de soporte de $ 0,1540. Se formó un mínimo en USD 0,1488 y DOGE ahora se está consolidando para el siguiente movimiento.
Dogecoin is still trading above the $0.150 level and the 100-hourly simple moving average. There is also a key bullish trend line forming with support at $0.1485 on the hourly chart of the DOGE/USD pair.
Dogecoin todavía cotiza por encima del nivel de $ 0,150 y el promedio móvil simple de 100 horas. También se está formando una línea de tendencia alcista clave con soporte en $ 0,1485 en el gráfico horario del par DOGE/USD.
On the upside, the price is facing resistance near the $0.1515 level. It is near the 23.6% Fib retracement level of the downward move from the $0.1594 swing high to the $0.1488 low.  Source: DOGEUSD on TradingView.com
Por el lado positivo, el precio enfrenta una resistencia cercana al nivel de $ 0,1515. Está cerca del nivel de retroceso de Fibonacci del 23,6% del movimiento descendente desde el máximo de $ 0,1594 hasta el mínimo de $ 0,1488. Fuente: DOGEUSD en TradingView.com
The next major resistance is near the $0.1540 level or the 50% Fib retracement level of the downward move from the $0.1594 swing high to the $0.1488 low. A close above the $0.1540 resistance might send the price toward the $0.160 resistance. Any more gains might send the price toward the $0.1650 level. The next major stop for the bulls might be $0.1720.
La siguiente resistencia importante está cerca del nivel de $0,1540 o el nivel de retroceso de Fibonacci del 50% del movimiento descendente desde el máximo de $0,1594 al mínimo de $0,1488. Un cierre por encima de la resistencia de $ 0,1540 podría enviar el precio hacia la resistencia de $ 0,160. Cualquier ganancia adicional podría enviar el precio hacia el nivel de $ 0,1650. La próxima parada importante para los alcistas podría ser 0,1720 dólares.
More Losses In DOGE?
¿Más pérdidas en DOGE?
If DOGE’s price fails to gain pace above the $0.1540 level, it could start another decline. Initial support on the downside is near the $0.150 level and the trend line.
Si el precio de DOGE no logra ganar ritmo por encima del nivel de $ 0,1540, podría iniciar otra caída. El soporte inicial a la baja está cerca del nivel de $ 0,150 y la línea de tendencia.
The next major support is near the $0.1445 level. If there is a downside break below the $0.1445 support, the price could decline further. In the stated case, the price might decline toward the $0.1350 level.
El siguiente soporte importante está cerca del nivel de 0,1445$. Si hay una ruptura a la baja por debajo del soporte de $ 0,1445, el precio podría caer aún más. En el caso indicado, el precio podría caer hacia el nivel de $ 0,1350.
Technical Indicators
Indicadores Técnicos
- Hourly MACD – The MACD for DOGE/USD is now losing momentum in the bearish zone.
- Hourly RSI (Relative Strength Index) – The RSI for DOGE/USD is now above the 50 level.
- Major Support Levels – $0.1500, $0.1445 and $0.1350.
- Major Resistance Levels – $0.1515, $0.1540, and $0.1600.
MACD por hora: el MACD para DOGE/USD ahora está perdiendo impulso en la zona bajista. RSI (índice de fuerza relativa) por hora: el RSI para DOGE/USD ahora está por encima del nivel 50. Principales niveles de soporte: $ 0,1500, $ 0,1445 y $ 0,1350. Principales Niveles de resistencia: $0,1515, $0,1540 y $0,1600.


 Crypto News Land
 BH NEWS
 DogeHome
 CryptoPotato_News
 CoinsProbe
 U.Today
 BlockchainReporter
 BlockchainReporter
 Crypto Intelligence


