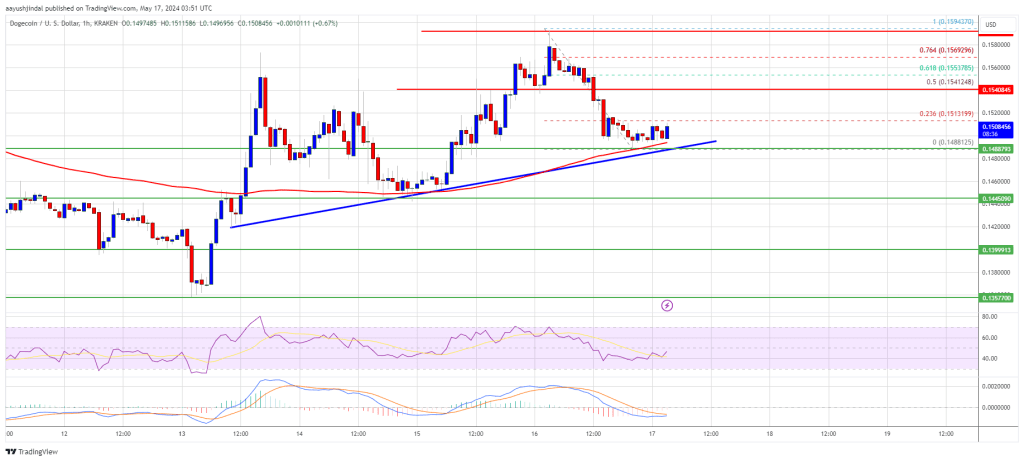
Dogecoin corrected gains and tested the $0.150 zone against the US Dollar. DOGE is now forming a base and might start a fresh increase above $0.1520.
ドージコインは上昇を修正し、対米ドルで0.150ドルゾーンをテストした。 DOGEは現在ベースを形成しており、0.1520ドルを超えて新たな上昇を開始する可能性があります。
DOGE price jumped toward $0.160 before correcting gains. The price is trading above the $0.150 level and the 100-hourly simple moving average. There is a key bullish trend line forming with support at $0.1485 on the hourly chart of the DOGE/USD pair (data source from Kraken). The price must settle above $0.1540 to move into a positive zone and start a fresh surge.
DOGE価格は上昇を修正する前に0.160ドルに向けて上昇しました。価格は0.150ドルのレベルと100時間の単純移動平均を上回って取引されている。 DOGE/USDペアの時間足チャートでは、0.1485ドルをサポートとして主要な強気トレンドラインが形成されています(データソースはKraken)。プラスゾーンに移行して新たな上昇を開始するには、価格が0.1540ドルを超えて安定する必要があります。
Dogecoin Price Holds Support
ドージコインの価格はサポートを維持
After a steady increase, Dogecoin price faced resistance near the $0.160 zone. A high was formed at $0.1594 before DOGE started a downside correction like Bitcoin and Ethereum. There was a drop below the $0.1540 support zone. A low was formed at $0.1488 and DOGE is now consolidating for the next move.
着実な上昇の後、ドージコインの価格は0.160ドルゾーン付近で抵抗に直面しました。 DOGEがビットコインやイーサリアムと同様に下値修正を開始する前に、高値は0.1594ドルで形成されました。 0.1540ドルのサポートゾーンを下回る下落があった。安値は0.1488ドルで形成され、DOGEは現在次の動きに向けて堅調となっている。
Dogecoin is still trading above the $0.150 level and the 100-hourly simple moving average. There is also a key bullish trend line forming with support at $0.1485 on the hourly chart of the DOGE/USD pair.
ドージコインは依然として0.150ドルのレベルと100時間の単純移動平均を上回って取引されている。 DOGE/USDペアの時間足チャートでは、0.1485ドルをサポートとして形成されている重要な強気トレンドラインもあります。
On the upside, the price is facing resistance near the $0.1515 level. It is near the 23.6% Fib retracement level of the downward move from the $0.1594 swing high to the $0.1488 low.  Source: DOGEUSD on TradingView.com
上値では、価格は0.1515ドル付近の抵抗線に直面している。これは、0.1594ドルのスイング高値から0.1488ドルの安値までの下降の23.6%Fibリトレースメントレベルに近いところにあります。出典: TradingView.comのDOGEUSD
The next major resistance is near the $0.1540 level or the 50% Fib retracement level of the downward move from the $0.1594 swing high to the $0.1488 low. A close above the $0.1540 resistance might send the price toward the $0.160 resistance. Any more gains might send the price toward the $0.1650 level. The next major stop for the bulls might be $0.1720.
次の主要な抵抗線は、0.1540ドルのレベル、または0.1594ドルのスイング高値から0.1488ドルの安値までの下降の50%Fibリトレースメントレベル付近です。終値が0.1540ドルの抵抗線を上回れば、価格は0.160ドルの抵抗線に向かう可能性がある。さらに上昇すると、価格は0.1650ドルの水準に向かう可能性がある。強気派の次の主要なストップは0.1720ドルになる可能性がある。
More Losses In DOGE?
DOGEで損失がさらに増える?
If DOGE’s price fails to gain pace above the $0.1540 level, it could start another decline. Initial support on the downside is near the $0.150 level and the trend line.
DOGE価格が0.1540ドルの水準を上回るペースで上昇できなければ、さらなる下落が始まる可能性がある。下値の最初のサポートは0.150ドルレベルとトレンドライン付近です。
The next major support is near the $0.1445 level. If there is a downside break below the $0.1445 support, the price could decline further. In the stated case, the price might decline toward the $0.1350 level.
次の主要なサポートは0.1445ドルレベル付近にある。 0.1445ドルのサポートを下回る下値ブレイクがあれば、価格はさらに下落する可能性がある。上記のケースでは、価格は 0.1350 ドルのレベルに向かって下落する可能性があります。
Technical Indicators
テクニカル指標
- Hourly MACD – The MACD for DOGE/USD is now losing momentum in the bearish zone.
- Hourly RSI (Relative Strength Index) – The RSI for DOGE/USD is now above the 50 level.
- Major Support Levels – $0.1500, $0.1445 and $0.1350.
- Major Resistance Levels – $0.1515, $0.1540, and $0.1600.
時間別 MACD – DOGE/USD の MACD は弱気ゾーンで勢いを失いつつあります。時間別 RSI (相対力指数) – DOGE/USD の RSI は現在 50 レベルを超えています。主要なサポート レベル – 0.1500 ドル、0.1445 ドル、0.1350 ドル。主要なサポート レベルレジスタンスレベル – 0.1515ドル、0.1540ドル、0.1600ドル。


 crypto.ro English
 DogeHome
 Crypto News Land
 ETHNews
 CFN
CFN U_Today
 Thecoinrepublic.com
 Optimisus


