- 1 Dogecoin breaks below the key moving averages of 20,50 and 100, showcasing bearishness.
- 2 DOGE price is taking support on the 200-Day Ema.
1 Dogecoin cae por debajo de los promedios móviles clave de 20,50 y 100, lo que muestra una actitud bajista.
2 El precio de DOGE está recibiendo soporte en la Ema de 200 días.
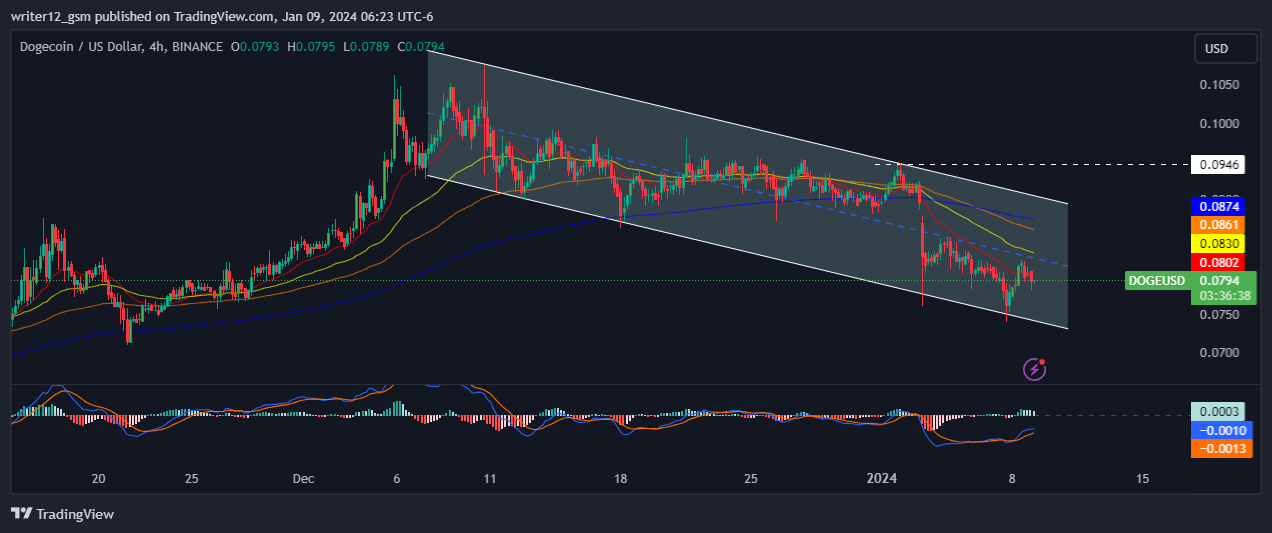
The Dogecoin price (USD: DOGE) is trading within a downward channel and making lower lows and lower highs. The crypto has attempted to reverse the current trend and break the critical level of $0.0946 below the 200-day EMA, but it failed. That shows the sellers are dominant and unwilling to give up on the trend.
El precio de Dogecoin (USD:DOGE) se cotiza dentro de un canal descendente y alcanza mínimos y máximos más bajos. La criptomoneda intentó revertir la tendencia actual y romper el nivel crítico de $ 0,0946 por debajo de la EMA de 200 días, pero fracasó. Eso muestra que los vendedores son dominantes y no están dispuestos a abandonar la tendencia.
At the time of writing, DOGE crypto was trading at $0.0789 with a loss of 3.43% for the day. It broke below the 200-day EMA, which indicates bearishness on the charts. The trading volume is 475.006 Million, showing a lack of interest from the buyers. The market cap of DOGE crypto is 11.321 Billion.
En el momento de escribir este artículo, la criptomoneda DOGE se cotizaba a $0,0789 con una pérdida del 3,43% en el día. Rompió por debajo de la EMA de 200 días, lo que indica una tendencia bajista en los gráficos. El volumen de operaciones es de 475.006 millones, lo que demuestra una falta de interés por parte de los compradores. La capitalización de mercado de la criptomoneda DOGE es de 11,321 mil millones.
However, DOGE crypto has stayed in a downtrend over the past months and persisted in forming lower highs and lower lows sequences, facing rejection from the upper trendline, which acted as a hurdle to exiting the trend. Moreover, the price action shows that Dogecoin crypto has persisted in facing selling pressure, and buyers have stayed on the back foot. In contrast, sellers have a strong edge and continue to make short positions.
Sin embargo, la criptomoneda DOGE se ha mantenido en una tendencia bajista durante los últimos meses y persistió en formar secuencias de máximos y mínimos más bajos, enfrentándose al rechazo de la línea de tendencia superior, que actuó como un obstáculo para salir de la tendencia. Además, la acción del precio muestra que la criptomoneda Dogecoin ha persistido en enfrentar la presión de venta y los compradores se han mantenido a la defensiva. Por el contrario, los vendedores tienen una fuerte ventaja y continúan tomando posiciones cortas.
What Do Technical Indicators Hint About the Dogecoin Crypto?
¿Qué sugieren los indicadores técnicos sobre la criptomoneda Dogecoin?

On the daily charts, Dogecoin crypto showed a falling channel pattern. The price is near the lower trendline below the 50-day EMA, showing weakness on the charts. Recently, the crypto bounced back from the channel lows and headed towards upper trendlines but got rejected.
En los gráficos diarios, la criptomoneda Dogecoin mostró un patrón de canal descendente. El precio está cerca de la línea de tendencia inferior por debajo de la EMA de 50 días, lo que muestra debilidad en los gráficos. Recientemente, la criptomoneda se recuperó de los mínimos del canal y se dirigió hacia líneas de tendencia superiores, pero fue rechazada.
Dogecoin price is trading below the key moving averages, showcasing bearishness on the chart. However, the price is currently taking support on the 200 EMA, maintaining the possibility of a bounceback.
El precio de Dogecoin cotiza por debajo de los promedios móviles clave, lo que muestra una tendencia bajista en el gráfico. Sin embargo, el precio actualmente tiene soporte en la EMA 200, lo que mantiene la posibilidad de un rebote.
Weekly-Time Horizon Analysis of Dogecoin Price
Análisis de horizonte semanal del precio de Dogecoin
Dogecoin crypto has shown sellers’ strength on the weekly time frame chart. Moreover, the price traded below the key EMAs, which indicates further weak points in the crypto.
La criptomoneda Dogecoin ha mostrado la fortaleza de los vendedores en el gráfico de tiempo semanal. Además, el precio cotizó por debajo de las EMA clave, lo que indica más puntos débiles en la criptografía.
However, the price-taking support on the 100 and 200 EMAs, shows support from buyers. Now faith in the price depends on whether it goes down or up from the current levels.
Sin embargo, el soporte de toma de precios en las EMA de 100 y 200 muestra el apoyo de los compradores. Ahora la fe en el precio depende de si baja o sube desde los niveles actuales.
Summary
Resumen
Dogecoin (USD: DOGE) technical oscillators support the bearish trend. The MACD, RSI, and EMA highlight negative signs and indicate that the downtrend may resume in the DOGE crypto price. Dogecoin Price action indicates that the investors and traders are bearish on the 1-D time frame.
Los osciladores técnicos de Dogecoin (USD:DOGE) respaldan la tendencia bajista. El MACD, el RSI y la EMA resaltan signos negativos e indican que la tendencia bajista puede reanudarse en el precio de las criptomonedas DOGE. La acción del precio de Dogecoin indica que los inversores y comerciantes son bajistas en el marco de tiempo 1-D.
The price action mirrors a bullish outlook at the moment. Moreover, Dogecoin Investors avoid the fear of missing out. Scarcity is constructed in the crypto market to acquire more additional investors and creditors. It is more profitable to keep it at arm’s length as this may result in one of the developing reasons for market volatility.
La acción del precio refleja una perspectiva alcista en este momento. Además, los inversores de Dogecoin evitan el miedo a perderse algo. La escasez se construye en el mercado de las criptomonedas para adquirir más inversores y acreedores adicionales. Es más rentable mantenerlo a distancia, ya que esto puede resultar en una de las razones en desarrollo de la volatilidad del mercado.
Technical Levels
Niveles Técnicos
Support Levels: $0.0569.
Niveles de soporte: $0.0569.
Resistance Levels: $0.1063.
Niveles de resistencia: $0,1063.
Disclaimer
Descargo de responsabilidad
This article is for informational purposes only and does not provide any financial, investment, or other advice. The author or any people mentioned in this article are not responsible for any financial loss that may occur from investing in or trading. Please do your own research before making any financial decisions.
Este artículo tiene únicamente fines informativos y no proporciona ningún consejo financiero, de inversión ni de otro tipo. El autor o cualquier persona mencionada en este artículo no son responsables de ninguna pérdida financiera que pueda ocurrir por invertir o comerciar. Haga su propia investigación antes de tomar cualquier decisión financiera.


 DogeHome
 Crypto Intelligence
 DogeHome
 CFN
CFN The Bit Journal
 Crypto Intelligence
 DeFi Planet
 Crypto News Land
 BH NEWS


