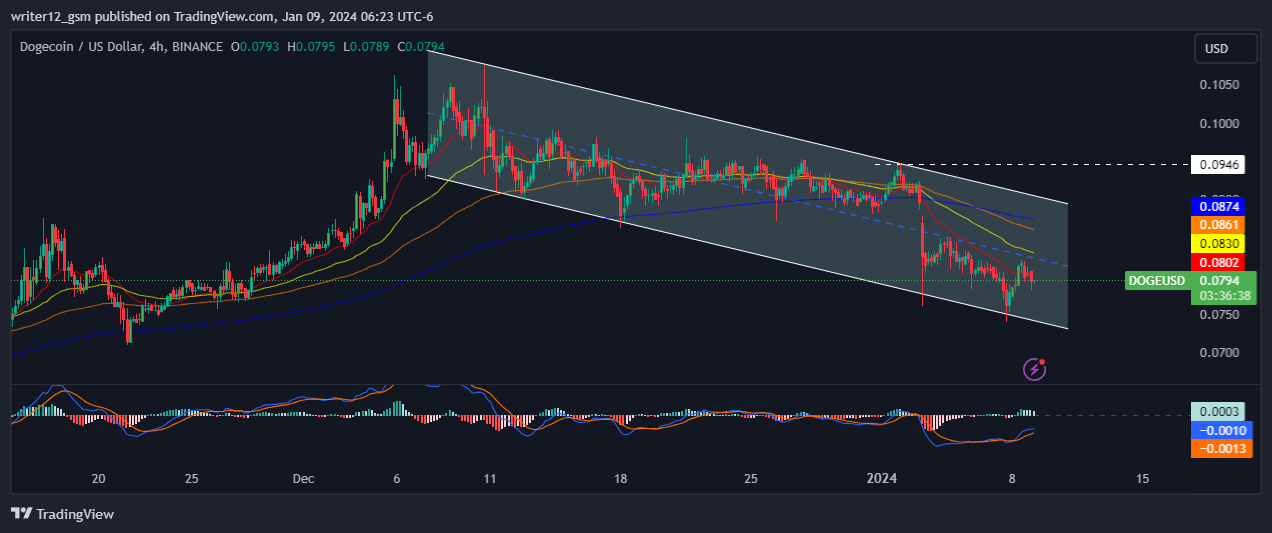
- 1 Dogecoin breaks below the key moving averages of 20,50 and 100, showcasing bearishness.
- 2 DOGE price is taking support on the 200-Day Ema.
1 Dogecoin은 주요 이동 평균인 20,50, 100 아래로 떨어지며 약세를 보여줍니다.
2 DOGE 가격은 200일 Ema를 지지하고 있습니다.
The Dogecoin price (USD: DOGE) is trading within a downward channel and making lower lows and lower highs. The crypto has attempted to reverse the current trend and break the critical level of $0.0946 below the 200-day EMA, but it failed. That shows the sellers are dominant and unwilling to give up on the trend.
Dogecoin 가격(USD: DOGE)은 하향 채널 내에서 거래되며 최저점과 고점이 낮아지고 있습니다. 암호화폐는 현재 추세를 반전시키고 200일 EMA 아래의 임계 수준인 $0.0946을 돌파하려고 시도했지만 실패했습니다. 이는 판매자가 지배적이며 추세를 포기할 의지가 없음을 보여줍니다.
At the time of writing, DOGE crypto was trading at $0.0789 with a loss of 3.43% for the day. It broke below the 200-day EMA, which indicates bearishness on the charts. The trading volume is 475.006 Million, showing a lack of interest from the buyers. The market cap of DOGE crypto is 11.321 Billion.
이 글을 쓰는 시점에 DOGE 암호화폐는 당일 3.43% 손실을 입어 0.0789달러에 거래되었습니다. 차트의 약세를 나타내는 200일 EMA 아래로 떨어졌습니다. 거래량은 4억7500만6000건으로 매수자들의 관심이 부족한 모습이다. DOGE 암호화폐의 시가총액은 113억 2100만 달러입니다.
However, DOGE crypto has stayed in a downtrend over the past months and persisted in forming lower highs and lower lows sequences, facing rejection from the upper trendline, which acted as a hurdle to exiting the trend. Moreover, the price action shows that Dogecoin crypto has persisted in facing selling pressure, and buyers have stayed on the back foot. In contrast, sellers have a strong edge and continue to make short positions.
그러나 DOGE 암호화폐는 지난 몇 달 동안 하락세를 유지했으며 계속해서 낮은 고점과 낮은 저점 시퀀스를 형성했으며 상위 추세선에서 거부되어 추세를 벗어나는 데 장애물로 작용했습니다. 더욱이, 가격 움직임은 Dogecoin 암호화폐가 매도 압력에 계속 직면해 있고 구매자들이 뒷걸음질치고 있음을 보여줍니다. 이와 대조적으로 판매자는 강한 우위를 갖고 있으며 계속해서 매도 포지션을 취합니다.
What Do Technical Indicators Hint About the Dogecoin Crypto?
기술 지표는 Dogecoin 암호화폐에 대해 무엇을 암시합니까?

On the daily charts, Dogecoin crypto showed a falling channel pattern. The price is near the lower trendline below the 50-day EMA, showing weakness on the charts. Recently, the crypto bounced back from the channel lows and headed towards upper trendlines but got rejected.
일일 차트에서 Dogecoin 암호화폐는 하락 채널 패턴을 보였습니다. 가격은 50일 EMA 아래 낮은 추세선 근처에 있으며 차트에서 약세를 보여줍니다. 최근 암호화폐는 채널 저점에서 반등하여 위쪽 추세선으로 향했지만 거부되었습니다.
Dogecoin price is trading below the key moving averages, showcasing bearishness on the chart. However, the price is currently taking support on the 200 EMA, maintaining the possibility of a bounceback.
Dogecoin 가격은 주요 이동 평균 아래에서 거래되어 차트에서 약세를 보여줍니다. 그러나 가격은 현재 200 EMA에서 지지를 받고 있어 반등 가능성을 유지하고 있습니다.
Weekly-Time Horizon Analysis of Dogecoin Price
Dogecoin 가격의 주간 시간 분석
Dogecoin crypto has shown sellers’ strength on the weekly time frame chart. Moreover, the price traded below the key EMAs, which indicates further weak points in the crypto.
Dogecoin 암호화폐는 주간 차트에서 판매자의 강세를 보여주었습니다. 더욱이 가격은 주요 EMA 아래에서 거래되었으며 이는 암호화폐의 추가적인 약점을 나타냅니다.
However, the price-taking support on the 100 and 200 EMAs, shows support from buyers. Now faith in the price depends on whether it goes down or up from the current levels.
그러나 100 및 200 EMA에 대한 가격 수용 지원은 구매자의 지원을 보여줍니다. 이제 가격에 대한 믿음은 현재 수준에서 하락할지 상승할지에 따라 달라집니다.
Summary
요약
Dogecoin (USD: DOGE) technical oscillators support the bearish trend. The MACD, RSI, and EMA highlight negative signs and indicate that the downtrend may resume in the DOGE crypto price. Dogecoin Price action indicates that the investors and traders are bearish on the 1-D time frame.
Dogecoin(USD: DOGE) 기술 오실레이터는 약세 추세를 지원합니다. MACD, RSI 및 EMA는 부정적인 신호를 강조하고 DOGE 암호화폐 가격의 하락세가 재개될 수 있음을 나타냅니다. Dogecoin 가격 움직임은 투자자와 거래자가 1차원 시간 프레임에서 약세를 보이고 있음을 나타냅니다.
The price action mirrors a bullish outlook at the moment. Moreover, Dogecoin Investors avoid the fear of missing out. Scarcity is constructed in the crypto market to acquire more additional investors and creditors. It is more profitable to keep it at arm’s length as this may result in one of the developing reasons for market volatility.
가격 움직임은 현재 낙관적인 전망을 반영합니다. 또한 Dogecoin 투자자는 누락에 대한 두려움을 피합니다. 희소성은 더 많은 추가 투자자와 채권자를 확보하기 위해 암호화폐 시장에 구축됩니다. 시장 변동성이 커지는 원인 중 하나가 될 수 있으므로 일정한 거리를 유지하는 것이 더 수익성이 높습니다.
Technical Levels
기술 수준
Support Levels: $0.0569.
지원 수준: $0.0569.
Resistance Levels: $0.1063.
저항 수준: $0.1063.
Disclaimer
부인 성명
This article is for informational purposes only and does not provide any financial, investment, or other advice. The author or any people mentioned in this article are not responsible for any financial loss that may occur from investing in or trading. Please do your own research before making any financial decisions.
이 기사는 정보 제공의 목적으로만 작성되었으며 재정, 투자 또는 기타 조언을 제공하지 않습니다. 이 글에 언급된 저자나 모든 사람들은 투자나 거래로 인해 발생할 수 있는 금전적 손실에 대해 책임을 지지 않습니다. 재정적 결정을 내리기 전에 스스로 조사해 보십시오.


 Cointelegraph
 Cryptopolitan_News
 Optimisus
 Thecoinrepublic.com
 Cryptopolitan_News
 CaptainAltcoin
 DogeHome
 crypto.news


