

Dogecoin's price has fallen over 60% since its December peak. However, recent network data suggests a potential turnaround for DOGE holders.
Dogecoin의 가격은 12 월 최고 이후 60% 이상 하락했습니다. 그러나 최근 네트워크 데이터는 Doge 보유자에게 잠재적 인 처리 시간을 제안합니다.
Yesterday, Dogecoin network activity surged dramatically, with active addresses increasing by 270%, jumping from 71,750 to 264,000 in just 24 hours. Such a significant increase often precedes price movements, making this a noteworthy development.
어제 Dogecoin 네트워크 활동은 급격히 급증했으며, 24 시간 만에 활성 주소가 270%증가하여 71,750에서 264,000으로 증가했습니다. 이러한 상당한 증가는 종종 가격 변동보다 우선하여 주목할만한 개발입니다.
Ascending Channel Pattern Hints at Dogecoin Rebound
오름차순 채널 패턴 힌트 Dogecoin Revound
DOGE is currently trading around $0.16841 following a 29.62% price drop. The $0.16 level is a crucial support zone, aligning with a previous Fibonacci retracement level (approximately 0.618) and holding historical significance.
Doge는 현재 29.62%의 가격 하락으로 약 $ 0.16841을 거래하고 있습니다. $ 0.16 레벨은 이전 Fibonacci retression 수준 (약 0.618)과 일치하고 역사적 중요성을 유지하는 중요한 지원 구역입니다.
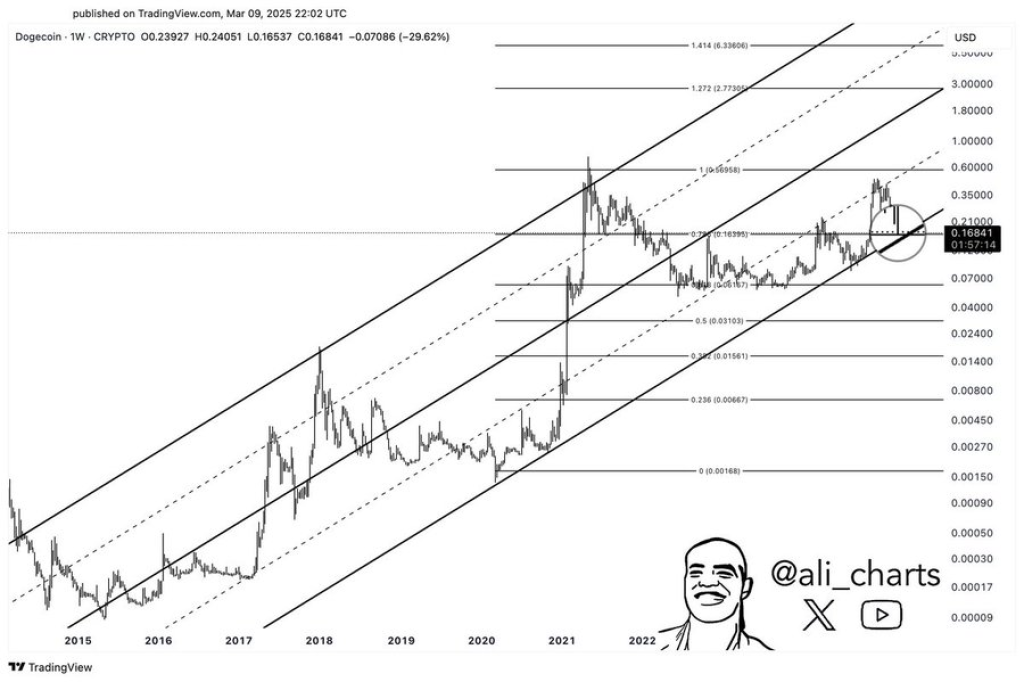
A broader perspective reveals that DOGE has been trading within an ascending parallel channel, indicating a potentially bullish long-term trend despite recent declines. The current price is testing a mid-range level within this channel, coinciding with a historically significant support zone.
더 넓은 관점은 Doge가 상승하는 병렬 채널 내에서 거래를 해왔으며, 이는 최근 하락에도 불구하고 잠재적으로 강세의 장기 추세를 나타냅니다. 현재 가격은 역사적으로 중요한 지원 구역과 일치하는이 채널 내에서 중간 범위 레벨을 테스트하고 있습니다.
If DOGE maintains its position at $0.16 and rebounds, it could potentially reach the next Fibonacci extension levels between $1.00 and $2.00. The $2.00 target is derived from extended 1.272 and 1.414 Fibonacci projections—levels often associated with significant price targets during bull markets. Conversely, a further price drop could see support between $0.10 and $0.12.
Doge가 $ 0.16에서 위치를 유지하고 리바운드를 유지하면 잠재적으로 $ 1.00에서 $ 2.00 사이의 다음 Fibonacci 확장 수준에 도달 할 수 있습니다. $ 2.00 목표는 연장 된 1.272 및 1.414 Fibonacci 예측에서 파생되었습니다. 반대로, 추가 가격 하락은 $ 0.10에서 $ 0.12 사이의 지원을 볼 수 있습니다.
Dogecoin's Historical Pattern Suggests Potential Upside
Dogecoin의 역사적 패턴은 잠재적 인 상승을 제안합니다
Trader Tardigrade has identified a recurring pattern in Dogecoin's price history since October 2022. Three significant pullbacks have occurred, each resulting in approximately a 64% drop, followed by explosive rallies of +300% and +500%.
Trader Tardigrade는 2022 년 10 월 이후 Dogecoin의 가격 역사상 반복 패턴을 확인했습니다. 3 개의 중요한 풀백이 발생하여 각각 64% 하락한 후 300% 및 500%의 폭발성 랠리가 발생했습니다.
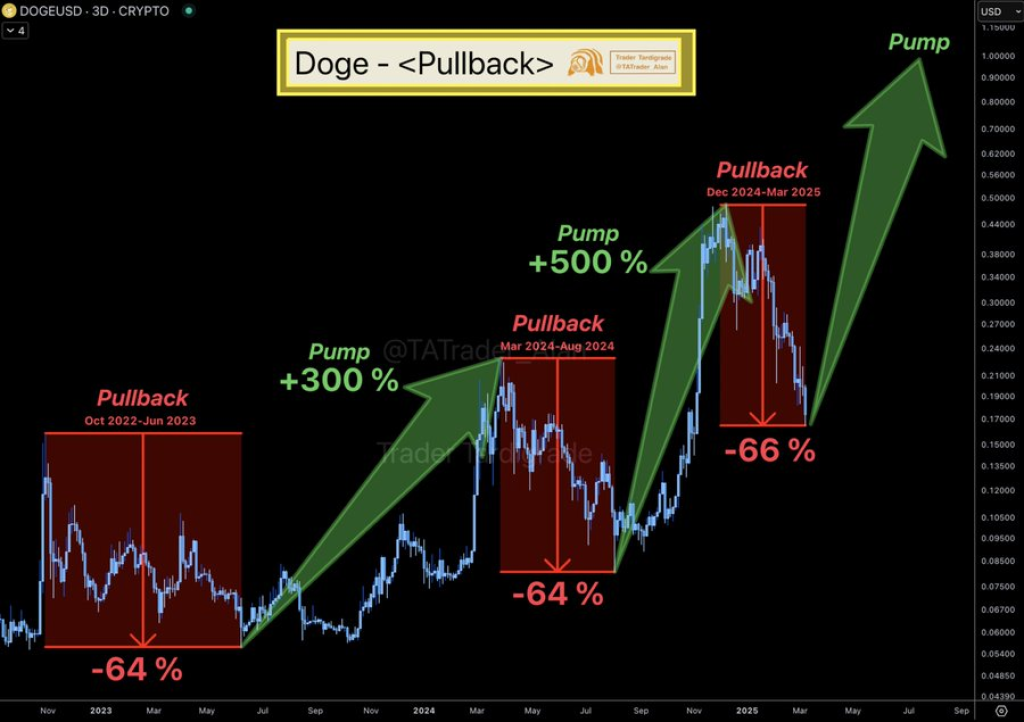
The current pullback is around 66%, mirroring previous corrections. If this pattern continues, another significant price increase towards $1.00 is possible.
현재의 풀백은 약 66%이며 이전 수정을 반영합니다. 이 패턴이 계속되면 $ 1.00에 대한 또 다른 상당한 가격 인상이 가능합니다.
This is a critical juncture for Dogecoin. Its performance at the $0.16 support level will be crucial in determining its trajectory in the coming months. The combination of increased network activity and the price reaching a technically significant support zone presents an intriguing scenario for this popular meme cryptocurrency.
이것은 Dogecoin의 비판적 시점입니다. $ 0.16의 지원 수준에서의 성과는 앞으로 몇 달 안에 궤적을 결정하는 데 중요합니다. 네트워크 활동 증가와 기술적으로 중요한 지원 구역에 도달하는 가격의 조합은이 인기있는 Meme cryptocurrency에 대한 흥미로운 시나리오를 나타냅니다.

The post Dogecoin Sees Major Surge in Active Addresses: Is a DOGE Price Rebound Near? appeared first on CaptainAltcoin.
Post Dogecoin은 활발한 주소의 주요 급증을보고 있습니다. Doge 가격이 가까워지고 있습니까? Captainaltcoin에서 처음 등장했습니다.
 Crypto Front News
 DogeHome
 Cointribune
 CoinPedia News
 CoinoMedia
 CoinEagle.com
 Cointelegraph
 Cryptopolitan_News


