21 de enero de 2024 a las 09:02 // Precio

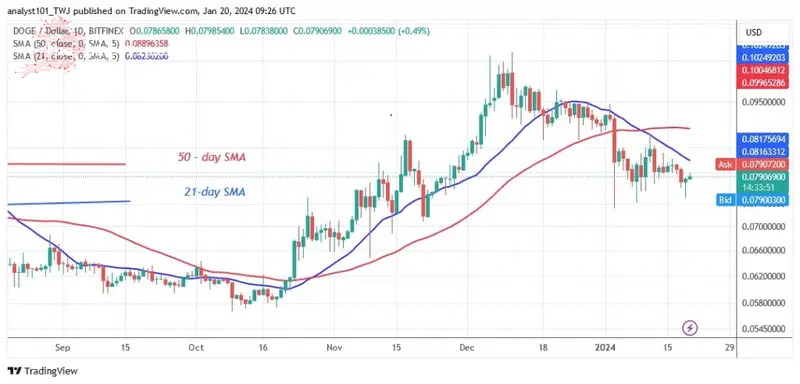
The price of Dogecoin (DOGE) has been below the moving average lines since the price slump on January 3, 2024.
El precio de Dogecoin (DOGE) ha estado por debajo de las líneas de media móvil desde la caída de precios del 3 de enero de 2024.
Long-term forecast for the Dogecoin price: bearish
Previsión a largo plazo para el precio de Dogecoin: bajista
Selling pressure has paused above the current support level of $0.073. The bears have not been able to sustain their bearish momentum to the $0.070 level over the past two weeks.
La presión de venta se ha detenido por encima del nivel de soporte actual de 0,073 dólares. Los bajistas no han podido mantener su impulso bajista hasta el nivel de 0,070 dólares durante las últimas dos semanas.
Nonetheless, the cryptocurrency fell to the lows of $0.074 and $0.075 before correcting higher. DOGE is currently trading at $0.074 and below the moving average lines. The market will fall above $0.070 if the current support level is broken. At this point, the altcoin is trading at $0.079.
No obstante, la criptomoneda cayó a mínimos de $0,074 y $0,075 antes de corregir al alza. DOGE cotiza actualmente a 0,074 dólares y por debajo de las líneas de media móvil. El mercado caerá por encima de $0,070 si se rompe el nivel de soporte actual. En este punto, la altcoin se cotiza a 0,079 dólares.
Dogecoin indicator reading
Lectura del indicador Dogecoin
The price bars have remained below the moving average lines for the past week, but the price action has stopped above the current support. The price bars are characterized by small, uncertain candlesticks known as dojis. DOGE is showing a bearish crossover with the 21-day SMA falling below the 50-day SMA.
Las barras de precios se han mantenido por debajo de las líneas de media móvil durante la semana pasada, pero la acción del precio se ha detenido por encima del soporte actual. Las barras de precios se caracterizan por velas pequeñas e inciertas conocidas como dojis. DOGE muestra un cruce bajista con la SMA de 21 días cayendo por debajo de la SMA de 50 días.
Technical Indicators
Indicadores Técnicos
Key resistance levels – $0.12 and $0.14
Niveles de resistencia clave: $0,12 y $0,14
Key support levels – $0.06 and $0.04
Niveles de soporte clave: $0,06 y $0,04

What is the next direction for Dogecoin?
¿Cuál es la próxima dirección para Dogecoin?
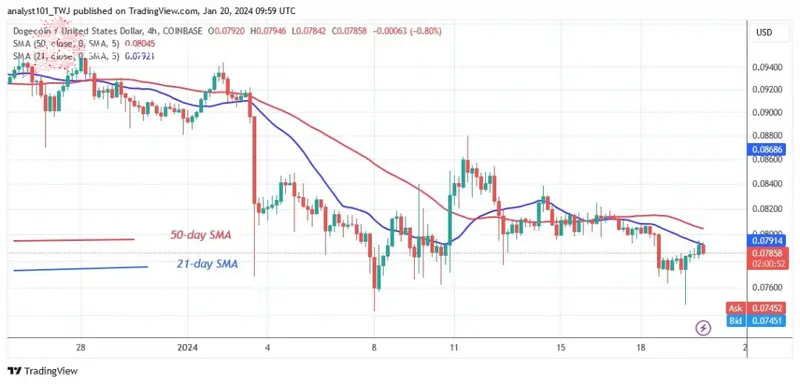
After the price drop on January 3, DOGE is moving sideways on the 4-hour chart. The price of the altcoin is currently hovering between $0.076 and $0.086. The moving average lines have limited the upside. DOGE is in a downtrend as it is rejected at the 21-day SMA.
Después de la caída de precios del 3 de enero, DOGE se mueve lateralmente en el gráfico de 4 horas. El precio de la altcoin oscila actualmente entre $0,076 y $0,086. Las líneas de media móvil han limitado la subida. DOGE está en una tendencia bajista ya que es rechazado en la SMA de 21 días.

Last week analyses predicted that DOGE/USD could fall further to the low of $0.070. This is because the resistance at $0.087 and the moving average lines were rejecting each other.
Los análisis de la semana pasada predijeron que DOGE/USD podría caer aún más hasta el mínimo de 0,070 dólares. Esto se debe a que la resistencia de 0,087 dólares y las líneas de media móvil se rechazaban entre sí.
Disclaimer. This Analysis and forecast are the personal opinions of the author and are not a recommendation to buy or sell cryptocurrency and should not be viewed as an endorsement by CoinIdol.com. Readers should do the research before investing in funds.
Descargo de responsabilidad. Este análisis y pronóstico son opiniones personales del autor y no son una recomendación para comprar o vender criptomonedas y no deben verse como un respaldo por parte de CoinIdol.com. Los lectores deben investigar antes de invertir en fondos.
Fuente: https://thebittimes.com/dogecoin-price-consolidates-and-reaches-decisive-support-at-0-070-tbt77219.html


 Crypto Daily™
 Crypto Daily™
 DogeHome
 TheCoinrise Media
 Thecoinrepublic.com
 TheCoinrise Media
 TheCoinrise Media
 Cryptopolitan_News


