Dogecoin is showing positive signs above the $0.0720 resistance against the US Dollar. DOGE could rally over 10% if it clears the $0.0765 resistance zone.
Dogecoin está mostrando signos positivos por encima de la resistencia de 0,0720 dólares frente al dólar estadounidense. DOGE podría recuperarse más del 10% si supera la zona de resistencia de $ 0,0765.
- DOGE started a decent increase above the $0.070 resistance against the US dollar.
- The price is trading below the $0.0720 level and the 100 simple moving average (4 hours).
- There is a key bullish trend line forming with support near $0.0712 on the 4-hour chart of the DOGE/USD pair (data source from Kraken).
- The price could start a strong rally like Solana if it clears the $0.0765 resistance.
DOGE inició un aumento decente por encima de la resistencia de 0,070 dólares frente al dólar estadounidense.
El precio se cotiza por debajo del nivel de $ 0,0720 y la media móvil simple de 100 (4 horas).
Se está formando una línea de tendencia alcista clave con soporte cerca de $ 0,0712 en el gráfico de 4 horas del par DOGE/USD (fuente de datos de Kraken).
El precio podría iniciar un fuerte repunte como el de Solana si supera la resistencia de $ 0,0765.
Dogecoin Price Aims Key Upside Break
El precio de Dogecoin apunta a una ruptura alcista clave
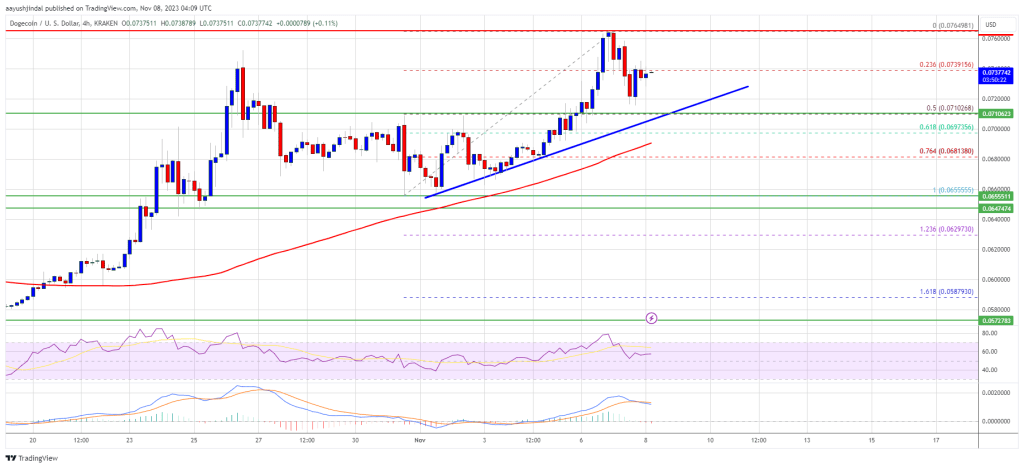
After forming a base above the $0.065 level, Dogecoin price started a fresh increase. DOGE broke the $0.0685 resistance zone to move into a positive zone, like Bitcoin and Ethereum.
Después de formar una base por encima del nivel de $ 0,065, el precio de Dogecoin comenzó un nuevo aumento. DOGE rompió la zona de resistencia de $ 0,0685 para pasar a una zona positiva, como Bitcoin y Ethereum.
The bulls were able to push the price further above the $0.0720 resistance. However, the price failed to clear the $0.0765 resistance and corrected lower. There was a move below the $0.0740 level. The price declined below the 23.6% Fib retracement level of the upward move from the $0.0655 swing low to the $0.0764 high.
Los alcistas pudieron impulsar el precio aún más por encima de la resistencia de $ 0,0720. Sin embargo, el precio no logró superar la resistencia de $ 0,0765 y se corrigió a la baja. Hubo un movimiento por debajo del nivel de $ 0,0740. El precio cayó por debajo del nivel de retroceso de Fibonacci del 23,6% del movimiento ascendente desde el mínimo de $ 0,0655 hasta el máximo de $ 0,0764.
DOGE is now trading above the $0.072 level and the 100 simple moving average (4 hours). There is also a key bullish trend line forming with support near $0.0712 on the 4-hour chart of the DOGE/USD pair. The trend line is near the 50% Fib retracement level of the upward move from the $0.0655 swing low to the $0.0764 high.
DOGE ahora cotiza por encima del nivel de $ 0,072 y el promedio móvil simple de 100 (4 horas). También se está formando una línea de tendencia alcista clave con soporte cerca de $ 0,0712 en el gráfico de 4 horas del par DOGE/USD. La línea de tendencia está cerca del nivel de retroceso del 50% del movimiento ascendente desde el mínimo de $ 0,0655 hasta el máximo de $ 0,0764.
Source: DOGEUSD on TradingView.com
Fuente: DOGEUSD en TradingView.com
On the upside, the price is facing resistance near the $0.0750 level. The first major resistance is near the $0.0765 level. A close above the $0.0765 resistance might send the price toward the $0.080 resistance. The next major resistance is near $0.0820. Any more gains might send the price toward the $0.085 level.
Por el lado positivo, el precio enfrenta una resistencia cercana al nivel de $ 0,0750. La primera resistencia importante está cerca del nivel de $ 0,0765. Un cierre por encima de la resistencia de $ 0,0765 podría enviar el precio hacia la resistencia de $ 0,080. La siguiente gran resistencia está cerca de 0,0820 dólares. Cualquier ganancia adicional podría enviar el precio hacia el nivel de $ 0,085.
Are Dips Limited in DOGE?
¿Las caídas son limitadas en DOGE?
If DOGE’s price fails to gain pace above the $0.0765 level, it could continue to move down. Initial support on the downside is near the $0.0720 level.
Si el precio de DOGE no logra ganar ritmo por encima del nivel de $ 0,0765, podría seguir bajando. El soporte inicial a la baja está cerca del nivel de $ 0,0720.
The next major support is near the $0.0712 level and the trend line. If there is a downside break below the $0.0712 support, the price could decline further. In the stated case, the price might decline toward the $0.070 level or the 100 simple moving average (4 hours).
El siguiente soporte importante está cerca del nivel de $ 0,0712 y la línea de tendencia. Si hay una ruptura a la baja por debajo del soporte de $ 0,0712, el precio podría caer aún más. En el caso indicado, el precio podría caer hacia el nivel de $ 0,070 o el promedio móvil simple de 100 (4 horas).
Technical Indicators
Indicadores Técnicos
4 Hours MACD – The MACD for DOGE/USD is now gaining momentum in the bullish zone.
MACD de 4 horas: el MACD para DOGE/USD ahora está ganando impulso en la zona alcista.
4 Hours RSI (Relative Strength Index) – The RSI for DOGE/USD is now above the 50 level.
RSI (índice de fuerza relativa) de 4 horas: el RSI para DOGE/USD ahora está por encima del nivel 50.
Major Support Levels – $0.0720, $0.0712, and $0.0700.
Principales niveles de soporte: $0,0720, $0,0712 y $0,0700.
Major Resistance Levels – $0.0750, $0.0765, and $0.0850.
Niveles de resistencia principales: $0,0750, $0,0765 y $0,0850.


 DogeHome
 Crypto Intelligence
 DogeHome
 CFN
CFN The Bit Journal
 Crypto Intelligence
 DeFi Planet
 Crypto News Land
 BH NEWS


