Dogecoin is showing positive signs above the $0.0720 resistance against the US Dollar. DOGE could rally over 10% if it clears the $0.0765 resistance zone.
狗狗幣兌美元匯率在 0.0720 美元阻力位上方顯示出正面跡象。如果 DOGE 突破 0.0765 美元的阻力區,其漲幅可能會超過 10%。
- DOGE started a decent increase above the $0.070 resistance against the US dollar.
- The price is trading below the $0.0720 level and the 100 simple moving average (4 hours).
- There is a key bullish trend line forming with support near $0.0712 on the 4-hour chart of the DOGE/USD pair (data source from Kraken).
- The price could start a strong rally like Solana if it clears the $0.0765 resistance.
DOGE 開始在兌美元阻力位 0.070 美元上方大幅上漲。
價格低於 0.0720 美元水準和 100 簡單移動平均線(4 小時)。
DOGE/USD 貨幣對的 4 小時圖表上有一條關鍵的看漲趨勢線在 0.0712 美元附近形成支撐(數據來源來自 Kraken)。
如果價格突破 0.0765 美元的阻力位,則可能會像 Solana 一樣開始強勁反彈。
Dogecoin Price Aims Key Upside Break
狗狗幣價格瞄準關鍵上行突破
After forming a base above the $0.065 level, Dogecoin price started a fresh increase. DOGE broke the $0.0685 resistance zone to move into a positive zone, like Bitcoin and Ethereum.
在 0.065 美元上方形成基礎後,狗狗幣價格開始新一輪上漲。 DOGE 突破了 0.0685 美元的阻力區,進入積極區域,就像比特幣和以太坊一樣。
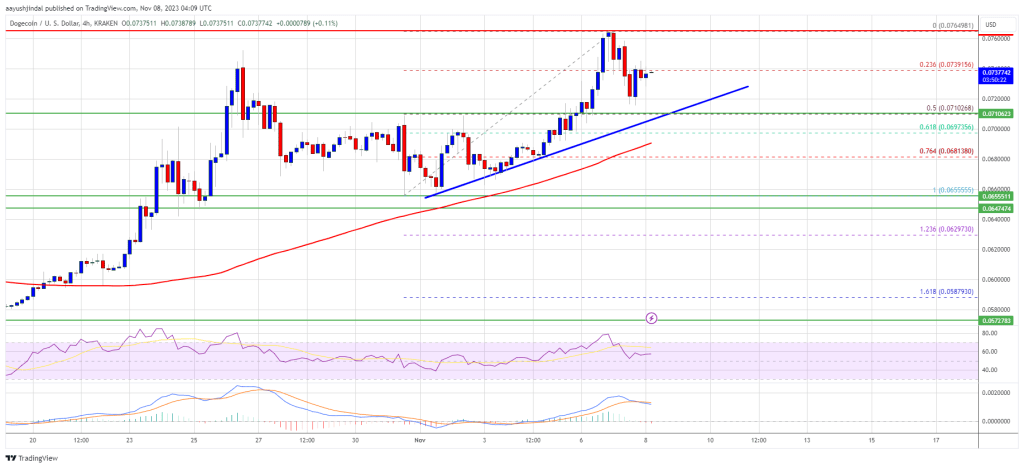
The bulls were able to push the price further above the $0.0720 resistance. However, the price failed to clear the $0.0765 resistance and corrected lower. There was a move below the $0.0740 level. The price declined below the 23.6% Fib retracement level of the upward move from the $0.0655 swing low to the $0.0764 high.
多頭能夠將價格進一步推高至 0.0720 美元阻力位上方。然而,價格未能突破 0.0765 美元阻力位並回調走低。跌破 0.0740 美元水準。價格跌破從 0.0655 美元波動低點至 0.0764 美元高點向上走勢的 23.6% Fib 回檔位。
DOGE is now trading above the $0.072 level and the 100 simple moving average (4 hours). There is also a key bullish trend line forming with support near $0.0712 on the 4-hour chart of the DOGE/USD pair. The trend line is near the 50% Fib retracement level of the upward move from the $0.0655 swing low to the $0.0764 high.
DOGE 目前交易價格高於 0.072 美元水準和 100 簡單移動平均線(4 小時)。 DOGE/USD 貨幣對的 4 小時圖表上還形成了一條關鍵的看漲趨勢線,支撐位在 0.0712 美元附近。趨勢線位於從 0.0655 美元波動低點到 0.0764 美元高點向上走勢的 50% Fib 回檔位附近。
Source: DOGEUSD on TradingView.com
資料來源:TradingView.com 上的 DOGEUSD
On the upside, the price is facing resistance near the $0.0750 level. The first major resistance is near the $0.0765 level. A close above the $0.0765 resistance might send the price toward the $0.080 resistance. The next major resistance is near $0.0820. Any more gains might send the price toward the $0.085 level.
從好的方面來看,價格在 0.0750 美元附近面臨阻力。第一個主要阻力位在 0.0765 美元附近。收盤價高於 0.0765 美元阻力位可能會將價格推向 0.080 美元阻力位。下一個主要阻力位在 0.0820 美元附近。任何更多的上漲可能會將價格推向 0.085 美元的水平。
Are Dips Limited in DOGE?
DOGE 跌幅有限嗎?
If DOGE’s price fails to gain pace above the $0.0765 level, it could continue to move down. Initial support on the downside is near the $0.0720 level.
如果 DOGE 的價格未能突破 0.0765 美元的水平,它可能會繼續下跌。下行的初步支撐位於 0.0720 美元附近。
The next major support is near the $0.0712 level and the trend line. If there is a downside break below the $0.0712 support, the price could decline further. In the stated case, the price might decline toward the $0.070 level or the 100 simple moving average (4 hours).
下一個主要支撐位於 0.0712 美元水平和趨勢線附近。如果跌破 0.0712 美元支撐位,價格可能會進一步下跌。在上述情況下,價格可能會跌向 0.070 美元的水平或 100 簡單移動平均線(4 小時)。
Technical Indicators
技術指標
4 Hours MACD – The MACD for DOGE/USD is now gaining momentum in the bullish zone.
4 小時 MACD – DOGE/USD 的 MACD 目前在看漲區域獲得動力。
4 Hours RSI (Relative Strength Index) – The RSI for DOGE/USD is now above the 50 level.
4 小時 RSI(相對強度指數)-DOGE/USD 的 RSI 目前高於 50 水準。
Major Support Levels – $0.0720, $0.0712, and $0.0700.
主要支撐位 – 0.0720 美元、0.0712 美元和 0.0700 美元。
Major Resistance Levels – $0.0750, $0.0765, and $0.0850.
主要阻力位 – 0.0750 美元、0.0765 美元和 0.0850 美元。


 Cryptopolitan_News
 Optimisus
 Crypto News Land
 DogeHome
 Crypto News Flash
 CoinsProbe
 CFN
CFN Cryptos Newss


