You can also read this news on COINTURK NEWS: Insights into Altcoin Season: Dogecoin, Shiba Inu, and Avalanche Analysis
También puede leer esta noticia en COINTURK NEWS: Información sobre la temporada de Altcoin: Dogecoin, Shiba Inu y análisis de avalanchas
One of the biggest discussions on the minds of many investors and analysts in the cryptocurrency market is undoubtedly the altcoin season. According to many analyses, the altcoin season has started, and during this period, many investors have made significant gains. Meme coins and artificial intelligence projects continue to be in the spotlight and please their investors. So, what’s happening lately with Dogecoin, Shiba Inu, and Avax? Let’s take a look.
Una de las mayores discusiones en la mente de muchos inversores y analistas del mercado de las criptomonedas es, sin duda, la temporada de altcoins. Según muchos análisis, la temporada de altcoins ha comenzado y durante este período, muchos inversores han obtenido ganancias significativas. Las monedas meme y los proyectos de inteligencia artificial siguen estando en el centro de atención y agradando a sus inversores. Entonces, ¿qué está pasando últimamente con Dogecoin, Shiba Inu y Avax? Vamos a ver.
Dogecoin Technical Analysis
Análisis técnico de Dogecoin
Bulls have failed to push and maintain Dogecoin above the $0.18 resistance in the past few days, but their persistence is a positive sign.
Los alcistas no han logrado impulsar y mantener a Dogecoin por encima de la resistencia de 0,18 dólares en los últimos días, pero su persistencia es una señal positiva.
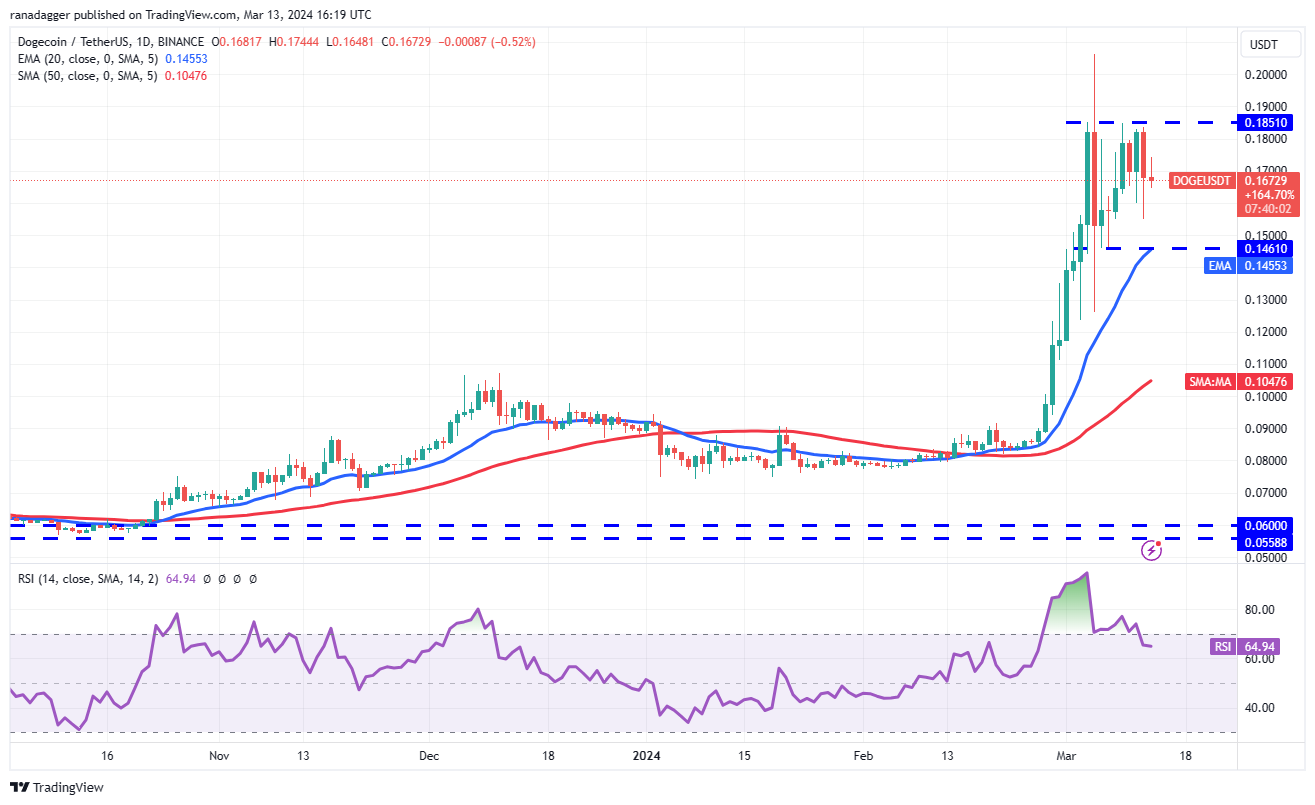
The rising 20-day EMA average of $0.15 and the RSI in the positive zone suggest that the path of least resistance is upwards. If buyers keep the price above $0.18, the DOGE/USDT pair could rise to $0.21. This level may again serve as resistance, but if surpassed, the pair could start its journey towards $0.24 and then $0.30.
El promedio creciente de la EMA de 20 días de $0,15 y el RSI en la zona positiva sugieren que el camino de menor resistencia es hacia arriba. Si los compradores mantienen el precio por encima de 0,18 dólares, el par DOGE/USDT podría subir a 0,21 dólares. Este nivel puede volver a servir como resistencia, pero si se supera, el par podría comenzar su viaje hacia USD 0,24 y luego hacia USD 0,30.
For bears to come back into play, they need to pull the price below $0.14. The pair could then drop to $0.12 and later to the 50-day SMA average of $0.10.
Para que los bajistas vuelvan a entrar en juego, deben bajar el precio por debajo de 0,14 dólares. Luego, el par podría caer a $0,12 y luego al promedio SMA de 50 días de $0,10.
Shiba Inu Technical Analysis
Análisis técnico Shiba Inu
Shiba Inu is consolidating in an uptrend as the price is trapped between $0.000029 and $0.000039. The consolidation after a sharp rally is a positive sign, indicating that bulls are not in a hurry to take profits. Bulls will try to push the price to the overall resistance of $0.000039. If this level is breached, the SHIB/USDT pair could reach $0.000046. This level could again pose a solid challenge for the bulls.
Shiba Inu se está consolidando en una tendencia alcista ya que el precio está atrapado entre $0,000029 y $0,000039. La consolidación después de un fuerte repunte es una señal positiva, que indica que los alcistas no tienen prisa por tomar ganancias. Los alcistas intentarán llevar el precio a la resistencia general de USD 0,000039. Si se supera este nivel, el par SHIB/USDT podría alcanzar los USD 0,000046. Este nivel podría volver a plantear un sólido desafío para los alcistas.
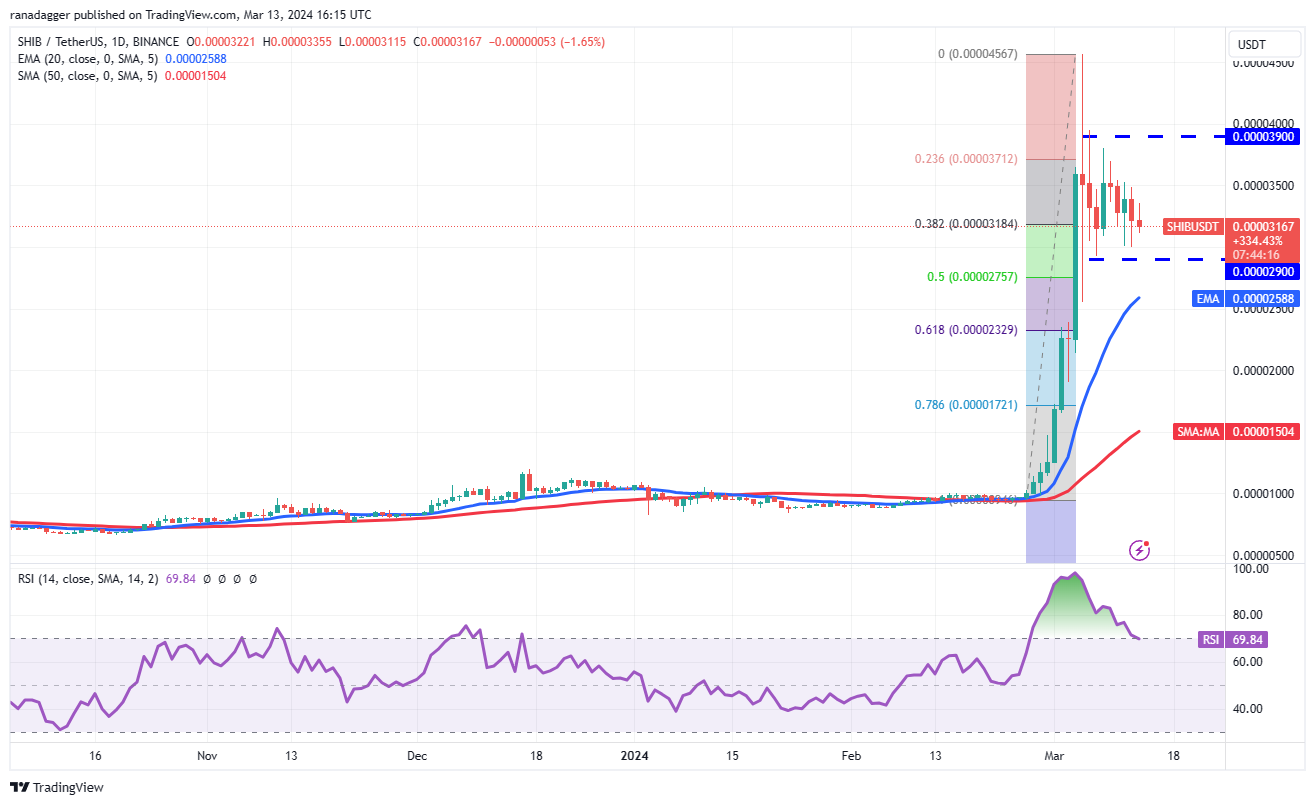
If the price falls and goes below $0.000029, the advantage will turn in favor of the bears. The pair could then slide to the 20-day EMA average of $0.000026 and later to the 61.8% Fibonacci retracement level of $0.000023.
Si el precio cae y cae por debajo de USD 0,000029, la ventaja se volverá a favor de los bajistas. Luego, el par podría deslizarse hasta el promedio de la EMA de 20 días de $0,000026 y luego hasta el nivel de retroceso de Fibonacci del 61,8% de $0,000023.
Avalanche Technical Analysis
Análisis técnico de avalancha
Avalanche showed bulls regaining their dominance by breaking above the general resistance of $45.15 on March 11th. The buying continued on March 12th, pushing the AVAX/USDT pair above the $50 resistance. Typically, after a significant resistance breakout, the price returns to test the breakout level. Therefore, a drop to $50 is possible.
Avalanche mostró que los alcistas recuperaron su dominio al superar la resistencia general de 45,15 dólares el 11 de marzo. Las compras continuaron el 12 de marzo, empujando al par AVAX/USDT por encima de la resistencia de $50. Normalmente, después de una ruptura significativa de la resistencia, el precio regresa para probar el nivel de ruptura. Por lo tanto, es posible una caída a $50.
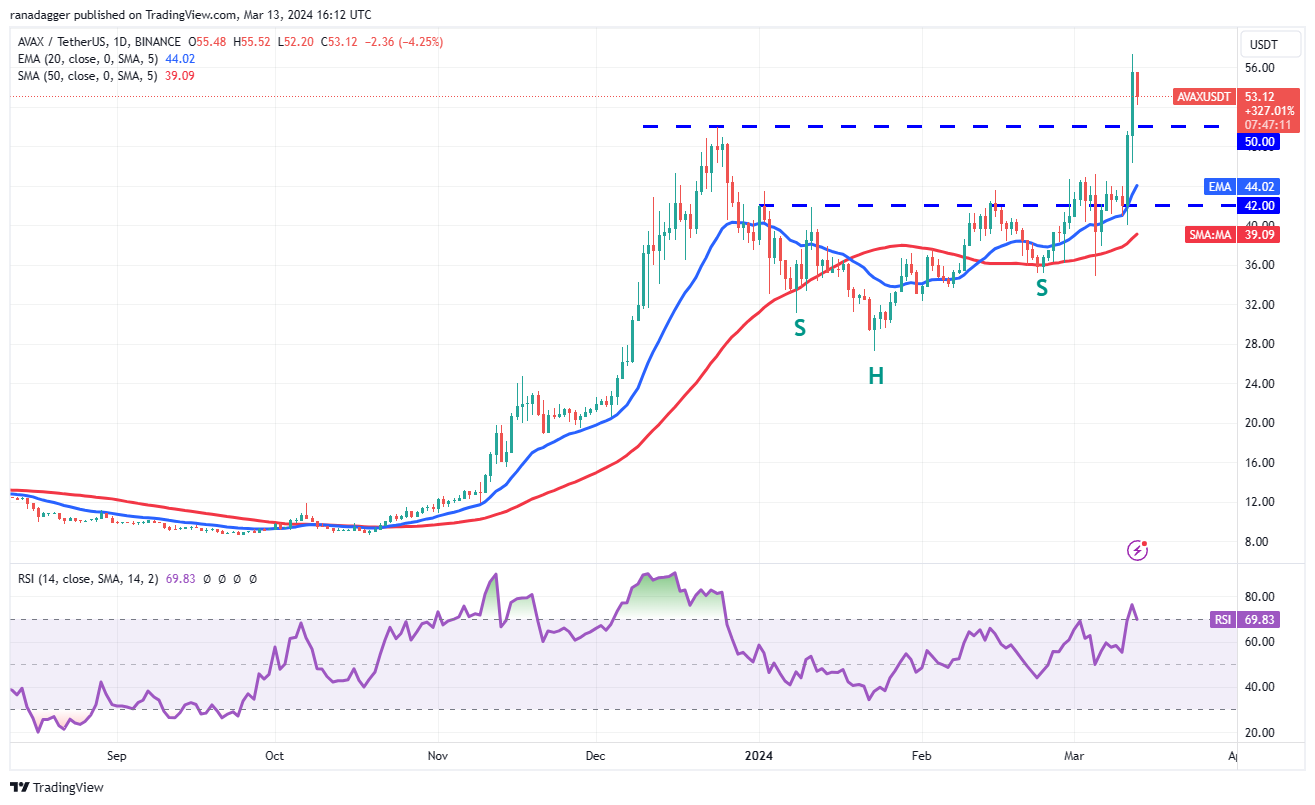
If bulls turn the $50 level into support, the likelihood of the uptrend continuing will increase. The pair could then rise to $67. Conversely, if the price breaks and stays below $50, it would indicate aggressive selling at higher levels. The pair could then fall to the 20-day EMA average of $44.
Si los alcistas convierten el nivel de 50 dólares en soporte, aumentará la probabilidad de que continúe la tendencia alcista. El par podría entonces subir a 67 dólares. Por el contrario, si el precio se rompe y se mantiene por debajo de 50 dólares, indicaría ventas agresivas en niveles más altos. Luego, el par podría caer al promedio de la EMA de 20 días de $44.
The post first appeared on COINTURK NEWS: Insights into Altcoin Season: Dogecoin, Shiba Inu, and Avalanche Analysis
La publicación apareció por primera vez en COINTURK NEWS: Información sobre la temporada de Altcoin: Dogecoin, Shiba Inu y análisis de avalanchas


 Cryptos Newss
 Coincu
 ItsBitcoinWorld
 DogeHome
 Crypto News Flash
 Crypto News Flash
 Crypto News Flash
 Optimisus
 DogeHome


