

You can also read this news on COINTURK NEWS: Insights into Altcoin Season: Dogecoin, Shiba Inu, and Avalanche Analysis
COINTURK NEWS: Altcoin 시즌에 대한 통찰력: Dogecoin, Shiba Inu 및 눈사태 분석에서도 이 뉴스를 읽을 수 있습니다.
One of the biggest discussions on the minds of many investors and analysts in the cryptocurrency market is undoubtedly the altcoin season. According to many analyses, the altcoin season has started, and during this period, many investors have made significant gains. Meme coins and artificial intelligence projects continue to be in the spotlight and please their investors. So, what’s happening lately with Dogecoin, Shiba Inu, and Avax? Let’s take a look.
암호화폐 시장의 많은 투자자와 분석가들이 생각하는 가장 큰 논의 중 하나는 의심할 여지 없이 알트코인 시즌입니다. 많은 분석에 따르면 알트코인 시즌이 시작되었고, 이 기간 동안 많은 투자자들이 상당한 이익을 얻었습니다. 밈 코인과 인공지능 프로젝트는 계속해서 주목을 받고 있으며 투자자들을 기쁘게 하고 있습니다. 그렇다면 최근 Dogecoin, Shiba Inu, Avax에서는 무슨 일이 일어나고 있나요? 한 번 보자.
Dogecoin Technical Analysis
Dogecoin 기술적 분석
Bulls have failed to push and maintain Dogecoin above the $0.18 resistance in the past few days, but their persistence is a positive sign.
강세론자들은 지난 며칠 동안 Dogecoin을 0.18달러 저항선 이상으로 밀어붙이고 유지하는 데 실패했지만 그들의 지속성은 긍정적인 신호입니다.
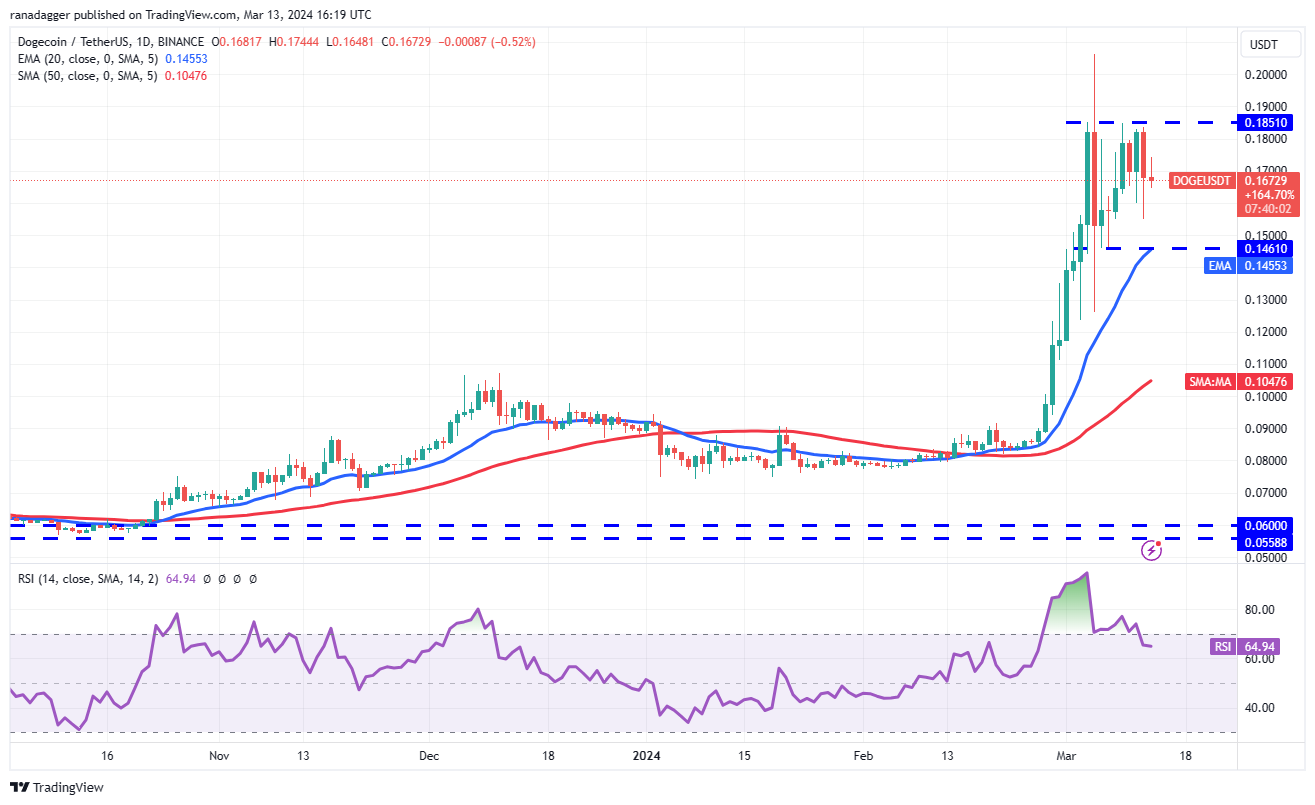
The rising 20-day EMA average of $0.15 and the RSI in the positive zone suggest that the path of least resistance is upwards. If buyers keep the price above $0.18, the DOGE/USDT pair could rise to $0.21. This level may again serve as resistance, but if surpassed, the pair could start its journey towards $0.24 and then $0.30.
20일 EMA 평균 $0.15 상승과 플러스 영역의 RSI는 저항이 가장 적은 경로가 위쪽임을 나타냅니다. 구매자가 가격을 $0.18 이상으로 유지하면 DOGE/USDT 쌍은 $0.21까지 상승할 수 있습니다. 이 수준은 다시 저항선 역할을 할 수 있지만, 이 수준을 넘어서면 0.24달러, 0.30달러를 향한 여정을 시작할 수 있습니다.
For bears to come back into play, they need to pull the price below $0.14. The pair could then drop to $0.12 and later to the 50-day SMA average of $0.10.
약세가 다시 시작되려면 가격을 0.14달러 아래로 끌어내려야 합니다. 그런 다음 쌍은 $0.12로 하락하고 나중에는 50일 SMA 평균 $0.10으로 떨어질 수 있습니다.
Shiba Inu Technical Analysis
시바견 기술적 분석
Shiba Inu is consolidating in an uptrend as the price is trapped between $0.000029 and $0.000039. The consolidation after a sharp rally is a positive sign, indicating that bulls are not in a hurry to take profits. Bulls will try to push the price to the overall resistance of $0.000039. If this level is breached, the SHIB/USDT pair could reach $0.000046. This level could again pose a solid challenge for the bulls.
Shiba Inu는 가격이 $0.000029에서 $0.000039 사이에 갇혀 상승 추세에 통합되고 있습니다. 급격한 랠리 이후의 횡보세는 긍정적인 신호로, 상승세가 서두르지 않고 이익을 추구하고 있음을 나타냅니다. Bulls는 가격을 전체 저항 $ 0.000039까지 끌어 올리려고 노력할 것입니다. 이 수준이 위반되면 SHIB/USDT 쌍은 $0.000046에 도달할 수 있습니다. 이 수준은 다시 강세론자들에게 확실한 도전이 될 수 있습니다.
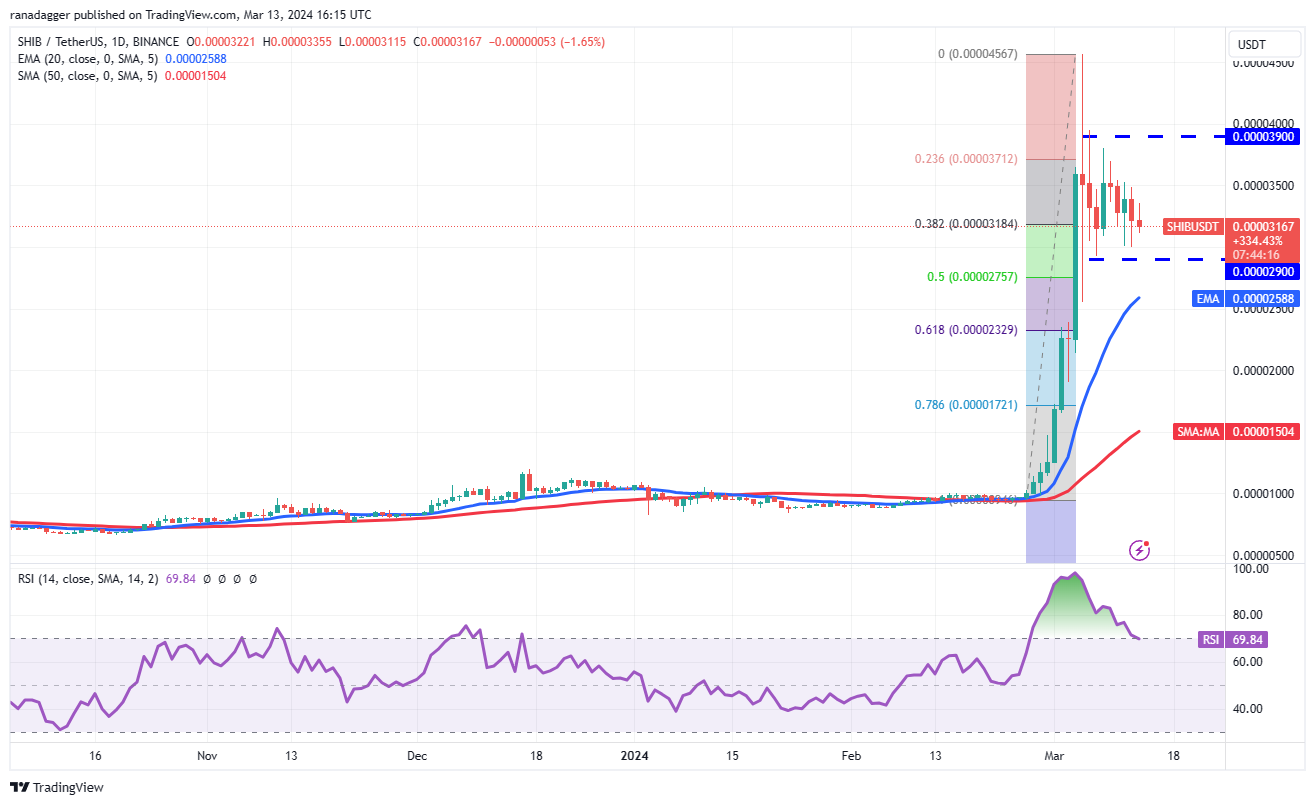
If the price falls and goes below $0.000029, the advantage will turn in favor of the bears. The pair could then slide to the 20-day EMA average of $0.000026 and later to the 61.8% Fibonacci retracement level of $0.000023.
가격이 하락하여 $0.000029 아래로 떨어지면 하락세에게 유리하게 유리하게 돌아갑니다. 그런 다음 해당 쌍은 20일 EMA 평균인 $0.000026까지 하락한 후 나중에 61.8% 피보나치 되돌림 수준인 $0.000023까지 하락할 수 있습니다.
Avalanche Technical Analysis
눈사태 기술적 분석
Avalanche showed bulls regaining their dominance by breaking above the general resistance of $45.15 on March 11th. The buying continued on March 12th, pushing the AVAX/USDT pair above the $50 resistance. Typically, after a significant resistance breakout, the price returns to test the breakout level. Therefore, a drop to $50 is possible.
Avalanche는 3월 11일에 전반적인 저항선인 $45.15를 돌파하여 강세장이 다시 지배력을 되찾는 모습을 보여주었습니다. 3월 12일에도 매수가 계속되면서 AVAX/USDT 쌍이 50달러 저항선 위로 올라갔습니다. 일반적으로 상당한 저항 돌파 후 가격은 돌파 수준을 테스트하기 위해 돌아옵니다. 따라서 $50까지 하락이 가능합니다.
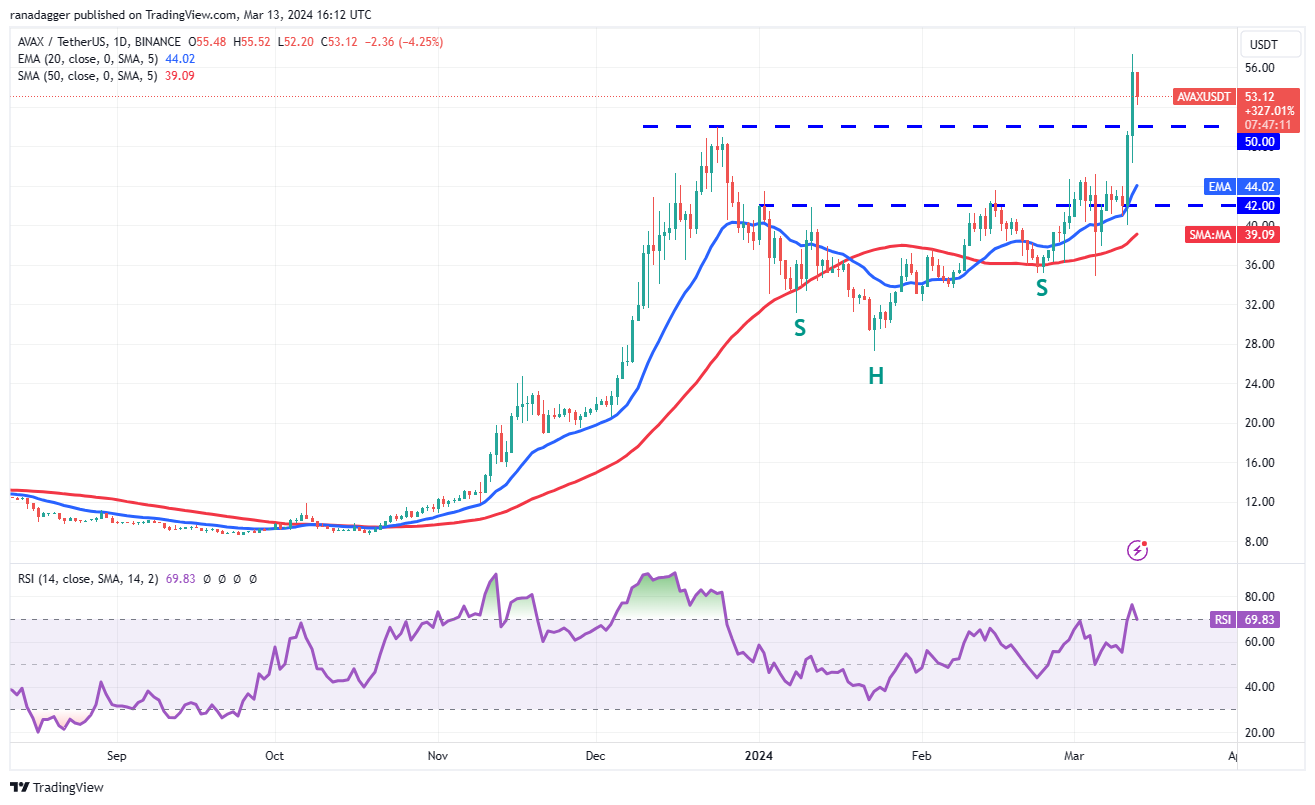
If bulls turn the $50 level into support, the likelihood of the uptrend continuing will increase. The pair could then rise to $67. Conversely, if the price breaks and stays below $50, it would indicate aggressive selling at higher levels. The pair could then fall to the 20-day EMA average of $44.
황소가 50달러 수준을 지지선으로 바꾸면 상승 추세가 지속될 가능성이 높아집니다. 그러면 그 쌍은 $67까지 오를 수 있습니다. 반대로, 가격이 50달러 미만으로 유지된다면 이는 더 높은 수준에서 공격적인 매도를 의미합니다. 그러면 해당 쌍은 20일 EMA 평균 $44까지 하락할 수 있습니다.
The post first appeared on COINTURK NEWS: Insights into Altcoin Season: Dogecoin, Shiba Inu, and Avalanche Analysis
해당 게시물은 COINTURK NEWS: Altcoin Season에 대한 통찰력: Dogecoin, Shiba Inu 및 눈사태 분석에 처음 게재되었습니다.
 Cryptopolitan
 DogeHome
 crypto.ro English
 Crypto News Land
 ETHNews
 CFN
CFN U_Today
 Thecoinrepublic.com


