Memecoins Drive Gains in Altcoin Market
Memecoins impulsan ganancias en el mercado de altcoins
Altcoins have experienced a significant upswing, with memecoins leading the charge. Memecoins, which emerged as the top-performing sector in 2024, continue to attract demand, closely followed by real-world asset (RWA) and artificial intelligence (AI) altcoins. Amidst the bull run in these community- and hype-driven altcoins, top names like Dogecoin (DOGE) and Shiba Inu (SHIB) flirt with a potential trend-reversal rally. Additionally, a new memecoin, Brett (BRETT), signals a strong breakout rally for substantial gains.
Las altcoins han experimentado un repunte significativo, con las memecoins a la cabeza. Las memecoins, que emergieron como el sector de mayor rendimiento en 2024, siguen atrayendo demanda, seguidas de cerca por las altcoins de activos del mundo real (RWA) y de inteligencia artificial (IA). En medio de la carrera alcista en estas altcoins impulsadas por la comunidad y la publicidad, nombres importantes como Dogecoin (DOGE) y Shiba Inu (SHIB) coquetean con un posible repunte de cambio de tendencia. Además, una nueva memecoin, Brett (BRETT), señala un fuerte repunte para obtener ganancias sustanciales.
Dogecoin (DOGE): Winking with Falling Wedge Formation
Dogecoin (DOGE): guiño con formación de cuña descendente
Dogecoin, the largest memecoin by market capitalization, is undergoing a corrective phase after hitting a yearly high of $0.22. DOGE's price fell from this high to the descending support trendline near $0.1175. This downtrend has formed a falling wedge pattern, with the negative cycle moving below the 200-day EMA. Despite this, Dogecoin is holding its fort above the psychological level of $0.10.
Dogecoin, la memecoin más grande por capitalización de mercado, está atravesando una fase correctiva después de alcanzar un máximo anual de 0,22 dólares. El precio de DOGE cayó desde este máximo hasta la línea de tendencia de soporte descendente cerca de 0,1175 dólares. Esta tendencia bajista ha formado un patrón de cuña descendente, con el ciclo negativo moviéndose por debajo de la EMA de 200 días. A pesar de esto, Dogecoin se mantiene fuerte por encima del nivel psicológico de 0,10 dólares.
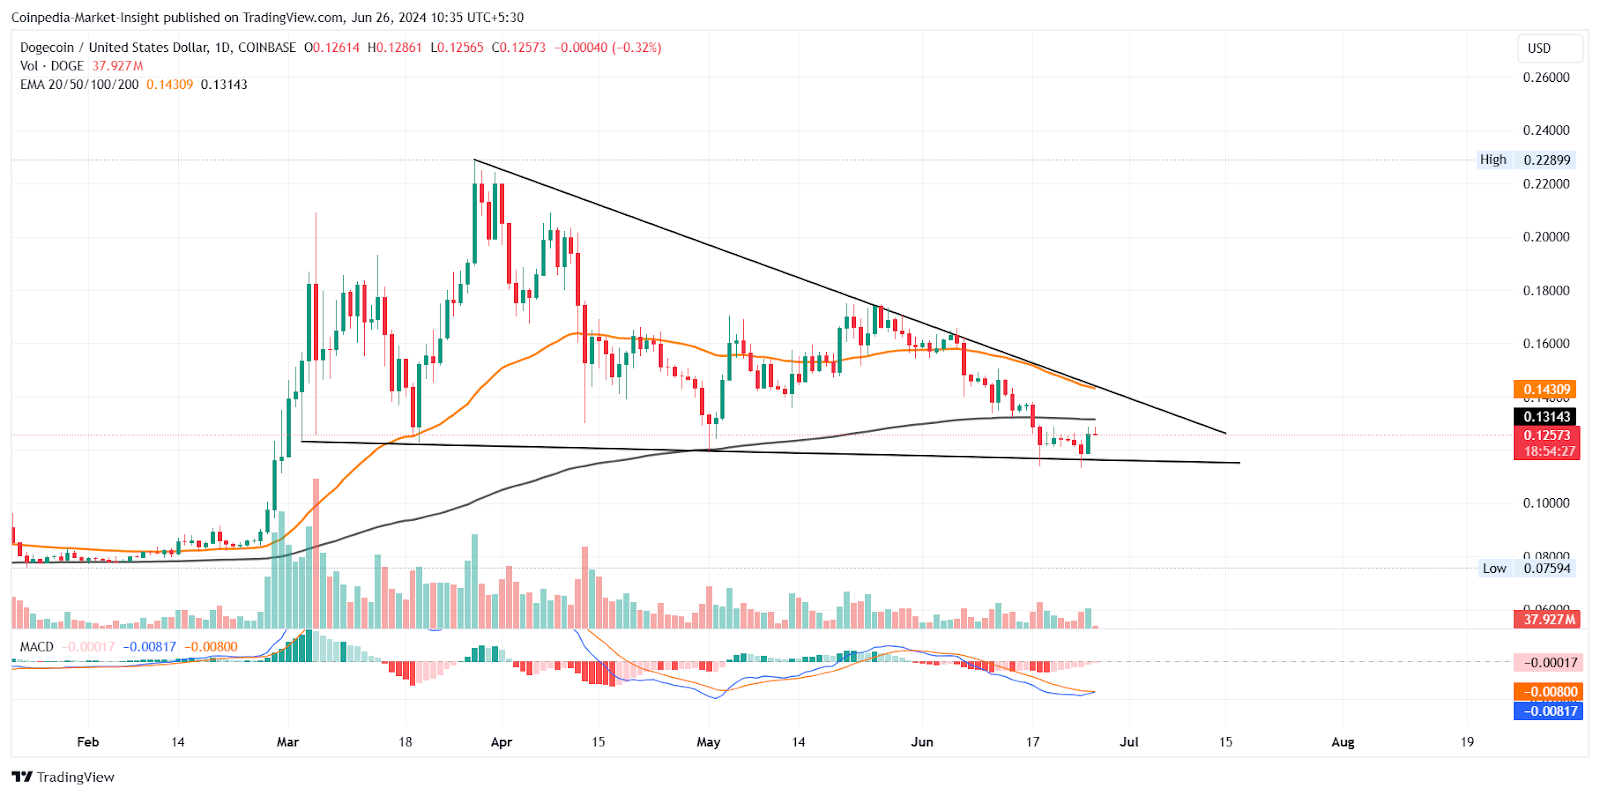
Currently, DOGE is trading at $0.12548, consolidating after an overnight jump of 6.05%. Technically, DOGE's price recovery has led to a bullish crossover of the MACD and signal lines, delaying the impending death cross on the daily chart. If the bullish cycle gains momentum within the falling wedge pattern, the memecoin could attempt a breakout rally towards the 50-day EMA at $0.14, and potentially $0.18 or $0.22.
Actualmente, DOGE cotiza a 0,12548 dólares, consolidándose después de un salto nocturno del 6,05%. Técnicamente, la recuperación del precio de DOGE ha provocado un cruce alcista del MACD y las líneas de señal, retrasando el inminente cruce de la muerte en el gráfico diario. Si el ciclo alcista gana impulso dentro del patrón de cuña descendente, la memecoin podría intentar un repunte hacia la EMA de 50 días a 0,14 dólares, y potencialmente a 0,18 dólares o 0,22 dólares.
Shiba Inu (SHIB): Standing Out with Falling Channel Formation
Shiba Inu (SHIB): destacando con la formación de canales descendentes
Shiba Inu, after hitting a 52-week high of $0.00004567, has developed a falling channel on the daily chart. The declining price has breached the 200-day EMA, threatening to form a death cross pattern on the daily chart. However, the negative cycle found quick support at $0.000017 before testing the support trendline, signaling an early reversal in the trend.
Shiba Inu, después de alcanzar un máximo de 52 semanas de 0,00004567 dólares, ha desarrollado un canal descendente en el gráfico diario. El precio a la baja ha superado la EMA de 200 días, amenazando con formar un patrón de cruce mortal en el gráfico diario. Sin embargo, el ciclo negativo encontró un soporte rápido en USD 0,000017 antes de probar la línea de tendencia de soporte, lo que indica una reversión temprana de la tendencia.
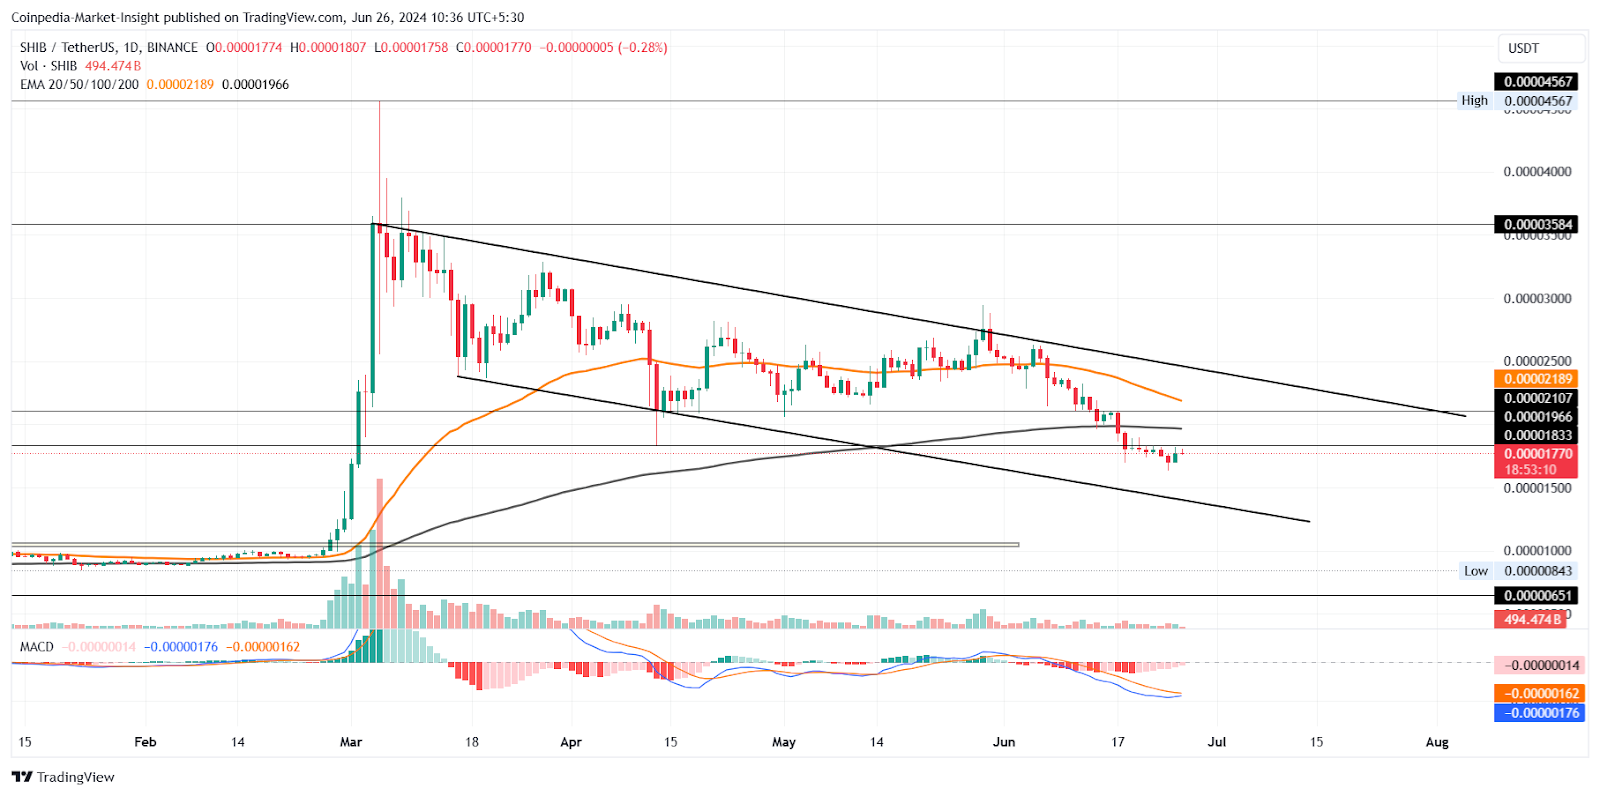
A bullish crossover in the MACD and signal lines supports the likelihood of a reversal. Should the upside momentum gather pace, SHIB has the potential to climb towards $0.000025 and attempt a channel breakout for a potential bull run towards $0.000035.
Un cruce alcista en el MACD y las líneas de señal respalda la probabilidad de una reversión. Si el impulso alcista se acelera, SHIB tiene el potencial de subir hacia USD 0,000025 e intentar una ruptura del canal para una posible corrida alcista hacia USD 0,000035.
BRETT: Sending Bullish Signal with Breakout
BRETT: Envío de señal alcista con ruptura
BRETT has established a strong support trendline, maintaining an overall uptrend. The price action on the 4-hour chart shows a triangle breakout, with the price breaking above a short-term resistance trendline. Following the recent bounce off the support trendline, BRETT's price surged over 25%, currently trading well above $0.15. The next potential move after this price jump is a potential retest at $0.15419.
BRETT ha establecido una fuerte línea de tendencia de soporte, manteniendo una tendencia alcista general. La acción del precio en el gráfico de 4 horas muestra una ruptura triangular, con el precio superando una línea de tendencia de resistencia a corto plazo. Tras el reciente rebote de la línea de tendencia de soporte, el precio de BRETT subió más del 25% y actualmente cotiza muy por encima de 0,15 dólares. El próximo movimiento potencial después de este salto de precios es una posible nueva prueba a 0,15419$.
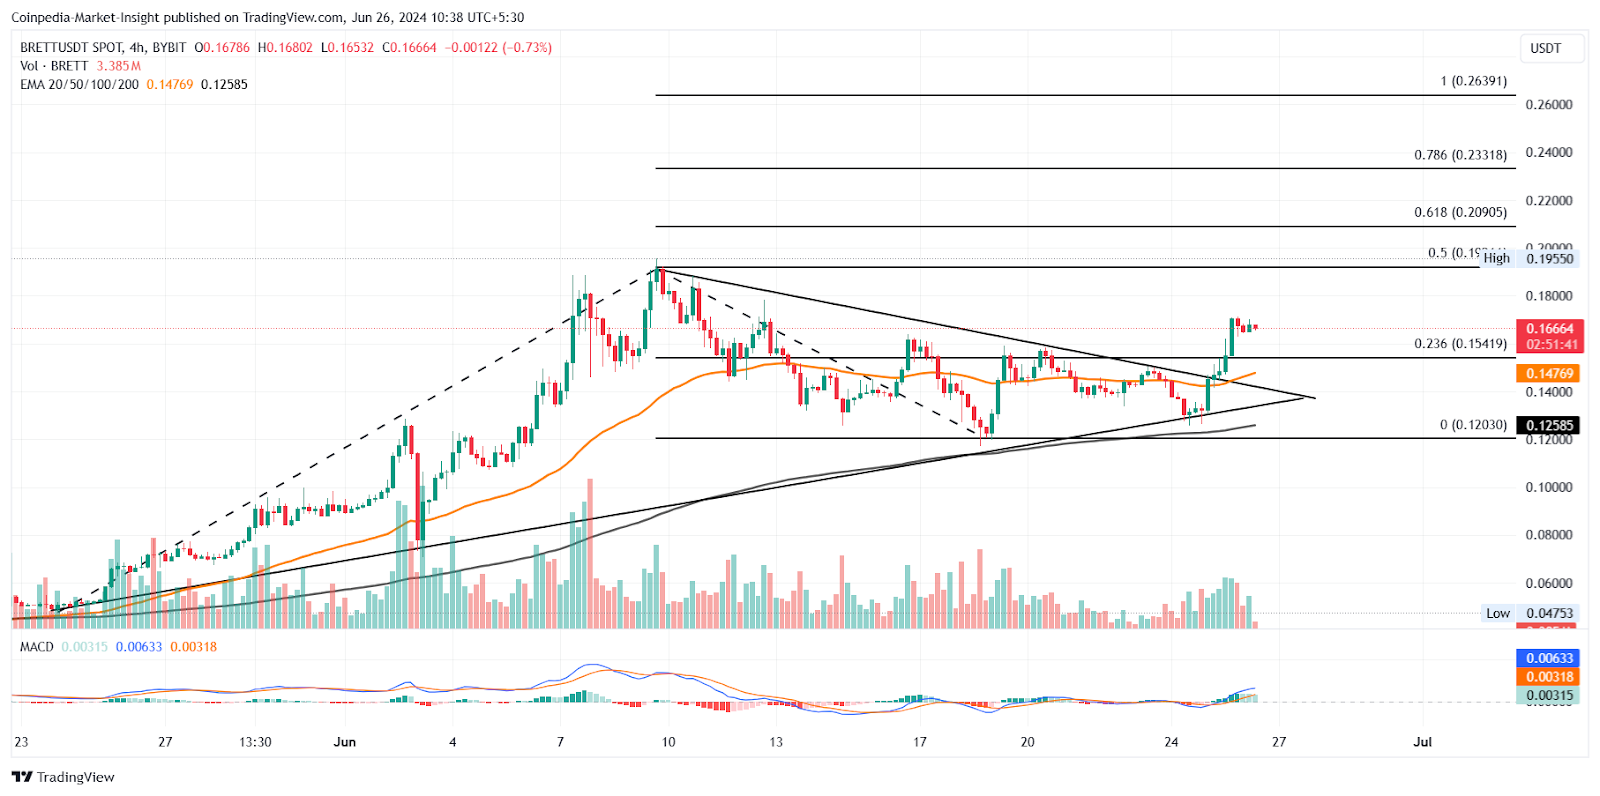
Based on trend-based Fibonacci levels, BRETT's price has the potential to climb towards $0.23318 over the coming month.
Según los niveles de Fibonacci basados en tendencias, el precio de BRETT tiene el potencial de subir a 0,23318 dólares durante el próximo mes.


 DogeHome
 crypto.news
 Crypto Intelligence
 crypto.news
 DogeHome
 Crypto Intelligence
 DogeHome
 CFN
CFN The Bit Journal


