Memecoins Drive Gains in Altcoin Market
Les Memecoins génèrent des gains sur le marché de l'Altcoin
Altcoins have experienced a significant upswing, with memecoins leading the charge. Memecoins, which emerged as the top-performing sector in 2024, continue to attract demand, closely followed by real-world asset (RWA) and artificial intelligence (AI) altcoins. Amidst the bull run in these community- and hype-driven altcoins, top names like Dogecoin (DOGE) and Shiba Inu (SHIB) flirt with a potential trend-reversal rally. Additionally, a new memecoin, Brett (BRETT), signals a strong breakout rally for substantial gains.
Les altcoins ont connu une hausse significative, les memecoins étant en tête. Les Memecoins, qui sont devenus le secteur le plus performant en 2024, continuent d’attirer la demande, suivis de près par les altcoins d’actifs du monde réel (RWA) et d’intelligence artificielle (IA). Au milieu de la course haussière de ces altcoins axés sur la communauté et le battage médiatique, de grands noms comme Dogecoin (DOGE) et Shiba Inu (SHIB) flirtent avec un potentiel rallye d'inversion de tendance. De plus, un nouveau memecoin, Brett (BRETT), signale un fort rallye pour des gains substantiels.
Dogecoin (DOGE): Winking with Falling Wedge Formation
Dogecoin (DOGE) : un clin d'œil avec la formation Falling Wedge
Dogecoin, the largest memecoin by market capitalization, is undergoing a corrective phase after hitting a yearly high of $0.22. DOGE's price fell from this high to the descending support trendline near $0.1175. This downtrend has formed a falling wedge pattern, with the negative cycle moving below the 200-day EMA. Despite this, Dogecoin is holding its fort above the psychological level of $0.10.
Dogecoin, le plus grand memecoin par capitalisation boursière, traverse une phase corrective après avoir atteint un sommet annuel de 0,22 $. Le prix du DOGE est passé de ce sommet à la ligne de tendance de support descendante proche de 0,1175 $. Cette tendance à la baisse a formé une configuration en coin descendant, le cycle négatif se déplaçant en dessous de l'EMA de 200 jours. Malgré cela, Dogecoin maintient sa position au-dessus du niveau psychologique de 0,10 $.
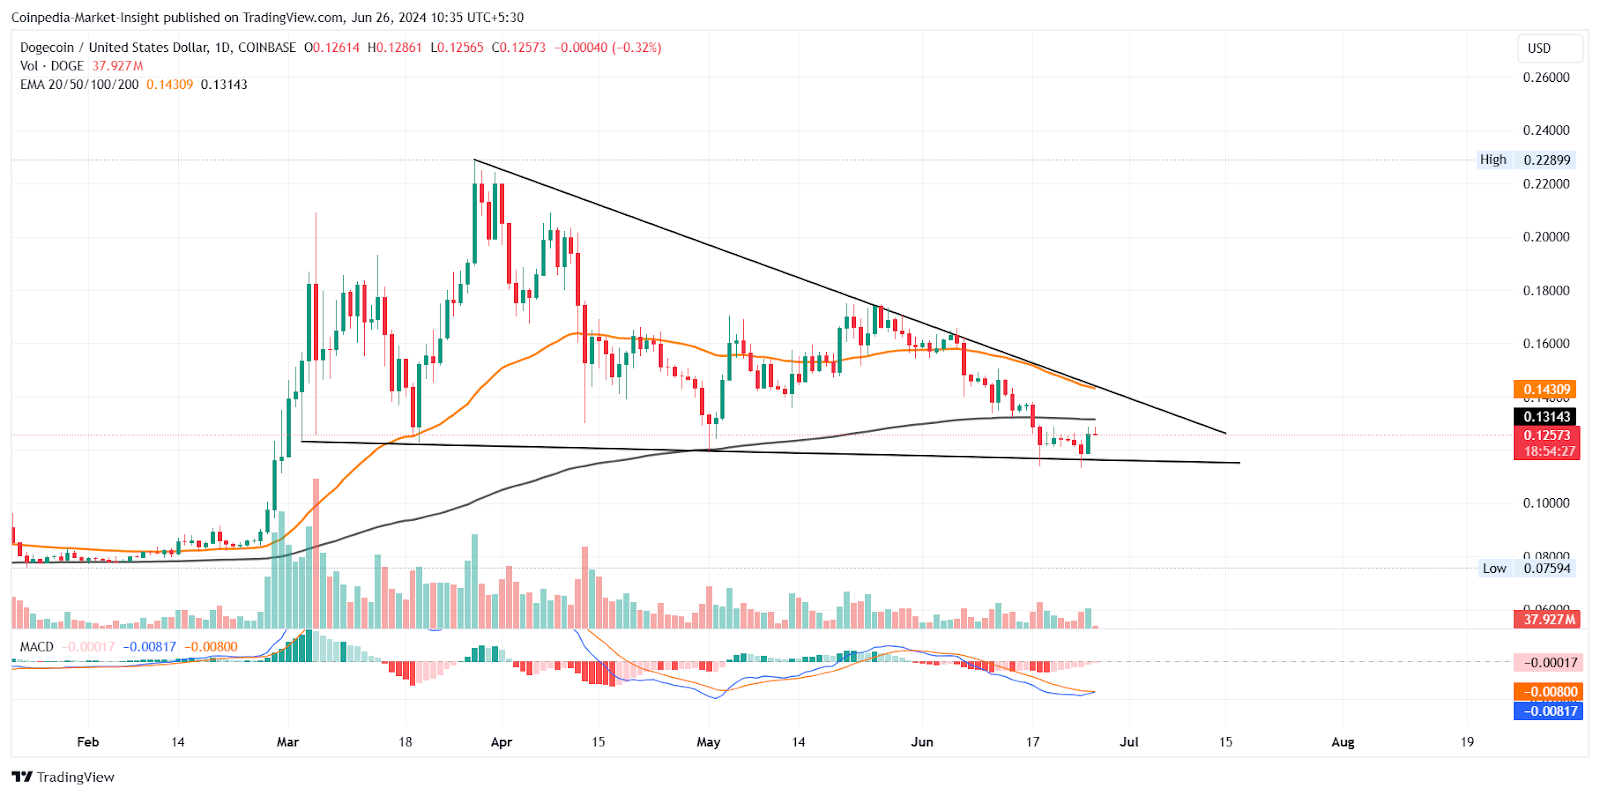
Currently, DOGE is trading at $0.12548, consolidating after an overnight jump of 6.05%. Technically, DOGE's price recovery has led to a bullish crossover of the MACD and signal lines, delaying the impending death cross on the daily chart. If the bullish cycle gains momentum within the falling wedge pattern, the memecoin could attempt a breakout rally towards the 50-day EMA at $0.14, and potentially $0.18 or $0.22.
Actuellement, DOGE se négocie à 0,12548 $, se consolidant après un bond nocturne de 6,05 %. Techniquement, la reprise des prix du DOGE a conduit à un croisement haussier du MACD et des lignes de signal, retardant le croisement mortel imminent sur le graphique journalier. Si le cycle haussier prend de l'ampleur dans le cadre de la configuration en biseau descendant, le memecoin pourrait tenter un rallye vers l'EMA de 50 jours à 0,14 $, et potentiellement 0,18 $ ou 0,22 $.
Shiba Inu (SHIB): Standing Out with Falling Channel Formation
Shiba Inu (SHIB) : se démarquer avec la formation de canaux tombants
Shiba Inu, after hitting a 52-week high of $0.00004567, has developed a falling channel on the daily chart. The declining price has breached the 200-day EMA, threatening to form a death cross pattern on the daily chart. However, the negative cycle found quick support at $0.000017 before testing the support trendline, signaling an early reversal in the trend.
Shiba Inu, après avoir atteint un sommet de 0,00004567 $ sur 52 semaines, a développé un canal baissier sur le graphique journalier. La baisse des prix a dépassé l'EMA de 200 jours, menaçant de former une figure de croix mortelle sur le graphique journalier. Cependant, le cycle négatif a trouvé un support rapide à 0,000017 $ avant de tester la ligne de tendance de support, signalant un renversement précoce de la tendance.
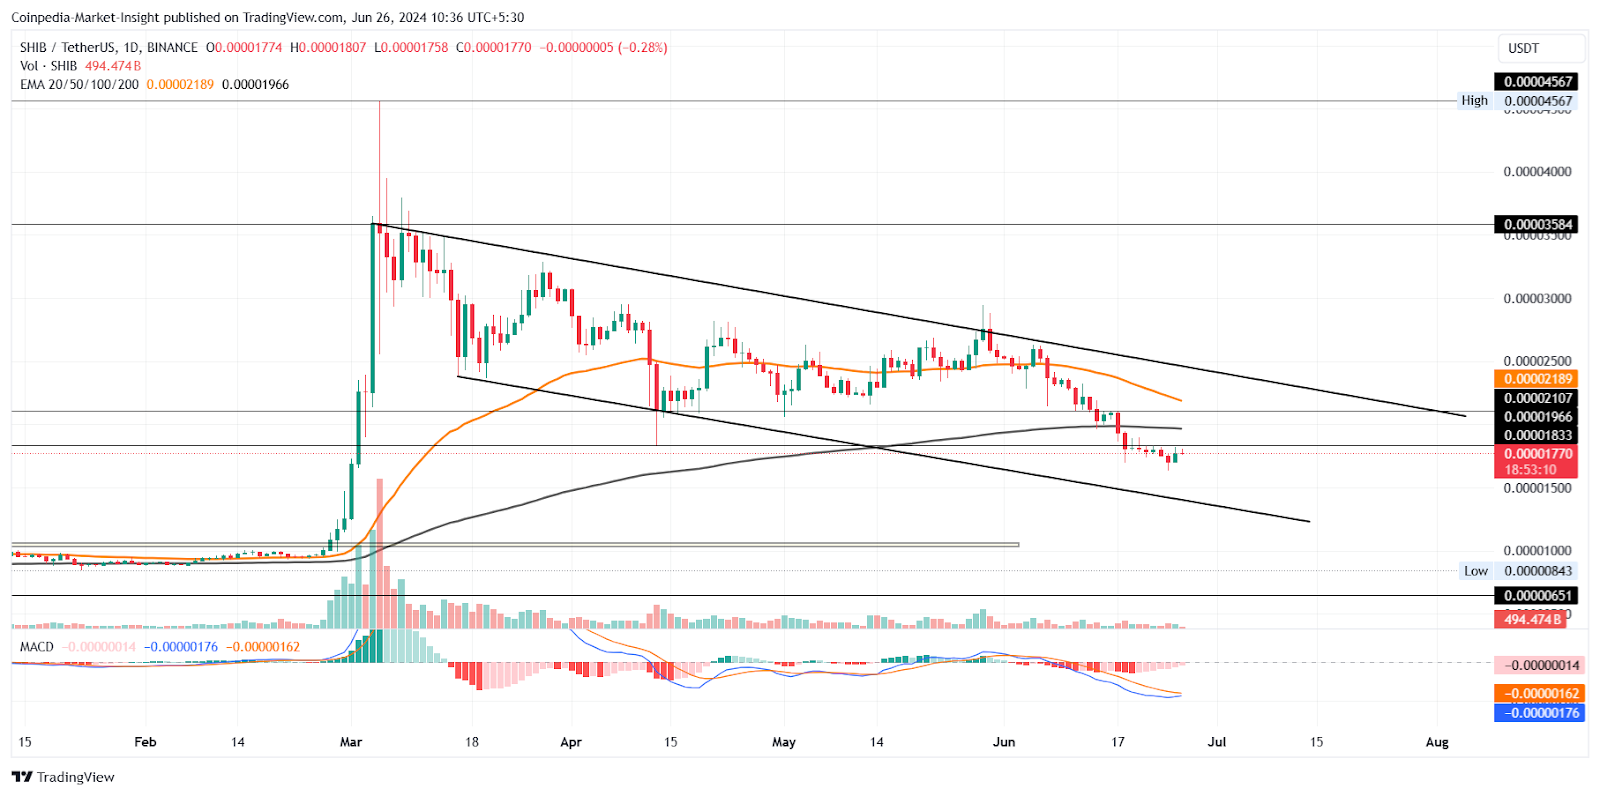
A bullish crossover in the MACD and signal lines supports the likelihood of a reversal. Should the upside momentum gather pace, SHIB has the potential to climb towards $0.000025 and attempt a channel breakout for a potential bull run towards $0.000035.
Un croisement haussier du MACD et des lignes de signal soutient la probabilité d'un renversement. Si la dynamique haussière s'accélère, SHIB a le potentiel de grimper jusqu'à 0,000025 $ et de tenter une cassure du canal pour une éventuelle course haussière vers 0,000035 $.
BRETT: Sending Bullish Signal with Breakout
BRETT : envoyer un signal haussier avec cassure
BRETT has established a strong support trendline, maintaining an overall uptrend. The price action on the 4-hour chart shows a triangle breakout, with the price breaking above a short-term resistance trendline. Following the recent bounce off the support trendline, BRETT's price surged over 25%, currently trading well above $0.15. The next potential move after this price jump is a potential retest at $0.15419.
BRETT a établi une ligne de tendance de support solide, maintenant une tendance globale à la hausse. L'évolution des prix sur le graphique en données de 4 heures montre une cassure triangulaire, le prix dépassant une ligne de tendance de résistance à court terme. Suite au récent rebond de la ligne de tendance de support, le prix de BRETT a bondi de plus de 25 %, s'échangeant actuellement bien au-dessus de 0,15 $. Le prochain mouvement potentiel après cette hausse des prix est un nouveau test potentiel à 0,15419 $.
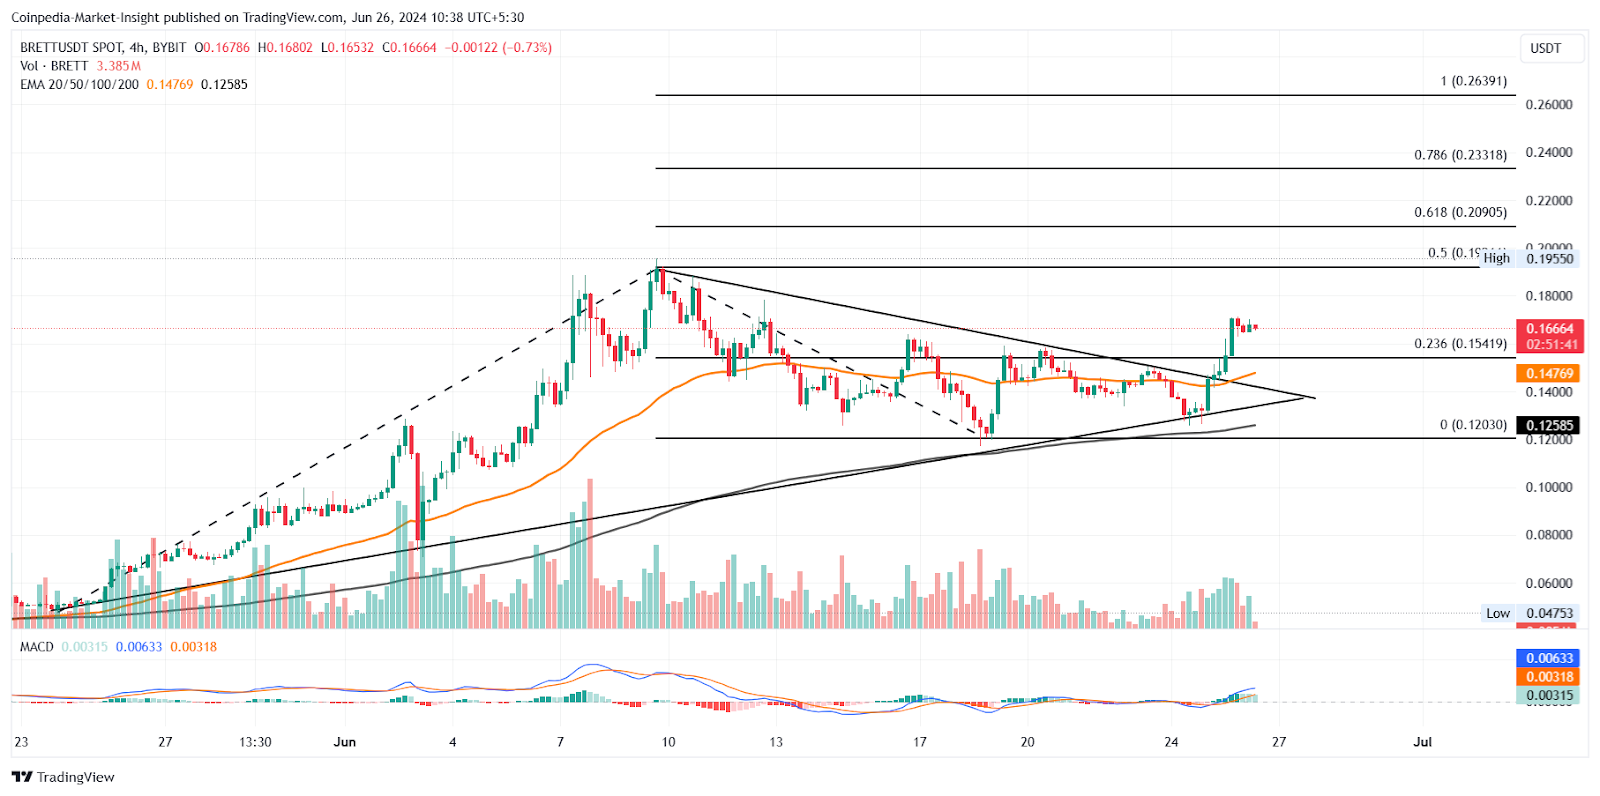
Based on trend-based Fibonacci levels, BRETT's price has the potential to climb towards $0.23318 over the coming month.
Sur la base des niveaux de Fibonacci basés sur la tendance, le prix de BRETT a le potentiel de grimper jusqu'à 0,23318 $ au cours du mois à venir.


 Crypto.ro
 Cryptopolitan_News
 BlockchainReporter
 Optimisus
 Inside Bitcoins
 Todayq News
 Optimisus
 CoinPedia News
 CoinPedia News


