Weekly crypto price analysis for major tokens such as Bitcoin( BTC), Ethereum (ETH), Binance(BNB), Solana(SOL), XRP, Cardano(ADA), and Dogecoin(DOGE) shows a promising outlook for the market. Most digital assets display positive momentum and challenging resistance levels, with slight correction over the past 24-hours.
El análisis semanal de precios de criptomonedas para los principales tokens como Bitcoin (BTC), Ethereum (ETH), Binance (BNB), Solana (SOL), XRP, Cardano (ADA) y Dogecoin (DOGE) muestra una perspectiva prometedora para el mercado. La mayoría de los activos digitales muestran un impulso positivo y niveles de resistencia desafiantes, con una ligera corrección en las últimas 24 horas.
Leading the pack, Bitcoin (BTC) has successfully maintained its position above the $70,000 mark, showing signs of a bullish momentum that could potentially elevate its value to the $75,000 threshold, making a two-year high. The broader market has mirrored this positive trend, with significant buying interest observed across several key cryptocurrencies.
Liderando el grupo, Bitcoin (BTC) ha mantenido con éxito su posición por encima de la marca de los $70,000, mostrando signos de un impulso alcista que potencialmente podría elevar su valor al umbral de los $75,000, alcanzando un máximo de dos años. El mercado en general ha reflejado esta tendencia positiva, con un importante interés de compra observado en varias criptomonedas clave.
Bitcoin (BTC) has kicked off the week on a positive note, attempting to stay above the $75,000 mark. The waiting anticipation around the Bitcoin halving event this month adds fuel to the bullish outlook for BTC and many other cryptocurrencies.
Bitcoin (BTC) ha comenzado la semana con una nota positiva, intentando mantenerse por encima de la marca de los 75.000 dólares. La expectación en torno al evento de reducción a la mitad de Bitcoin de este mes añade combustible a las perspectivas alcistas para BTC y muchas otras criptomonedas.
Investors and traders alike are gearing up for potential upward movements, as historically, halving events have led to significant price increases due to the reduced supply of new Bitcoins entering the market.
Tanto los inversores como los comerciantes se están preparando para posibles movimientos alcistas, ya que históricamente, los eventos de reducción a la mitad han provocado aumentos significativos de precios debido a la reducción de la oferta de nuevos Bitcoins que ingresan al mercado.
The broader market has mirrored this positive trend, with significant buying interest observed across several key cryptocurrencies. Crypto exchanges are having a frenzy with cryptocurrency trading.
El mercado en general ha reflejado esta tendencia positiva, con un importante interés de compra observado en varias criptomonedas clave. Los intercambios de criptomonedas están teniendo un frenesí con el comercio de criptomonedas.
Ethereum (ETH), holding the title of the second-largest digital currency by market cap, has not been left behind. The past week saw Ethereum breach the $3,500 barrier, a bullish signal reinforcing the positive market sentiment. Similarly, Binance Coin (BNB) has shown remarkable stability, consistently trading above $600 and inching closer to overcoming the $630 resistance mark.
Ethereum (ETH), que ostenta el título de segunda moneda digital por capitalización de mercado, no se ha quedado atrás. La semana pasada, Ethereum superó la barrera de los $ 3,500, una señal alcista que refuerza el sentimiento positivo del mercado. De manera similar, Binance Coin (BNB) ha mostrado una estabilidad notable, cotizando constantemente por encima de los $600 y acercándose poco a poco a superar la marca de resistencia de los $630.
Solana (SOL), known for its efficiency and lower transaction costs, has emerged as one of the monthly standout performers, with its price soaring past $170. XRP has also enjoyed a week of gains, climbing by over 4% and trading above $0.61. This upward movement has sparked conversations about its potential to reach the $0.7 mark. Cardano (ADA) and Dogecoin (DOGE) are not far behind, with ADA appreciating by more than 2% and DOGE gaining more than 13%, reflecting a strong bullish trend in the meme coin sector.
Solana (SOL), conocida por su eficiencia y menores costos de transacción, se ha convertido en uno de los actores más destacados mensualmente, con su precio superando los 170 dólares. XRP también ha disfrutado de una semana de ganancias, subiendo más del 4% y cotizando por encima de 0,61 dólares. Este movimiento ascendente ha provocado conversaciones sobre su potencial para alcanzar la marca de 0,7 dólares. Cardano (ADA) y Dogecoin (DOGE) no se quedan atrás, con ADA revalorizándose más del 2% y DOGE ganando más del 13%, lo que refleja una fuerte tendencia alcista en el sector de las monedas meme.
Bitcoin(BTC)
Bitcoin (BTC)
Bitcoin (BTC) has shown a bullish trend in the recent weekly price analysis, consistently finding strong support above the $70,000 mark. This solid foundation sets the stage for an anticipated upward movement toward a $75,000 resistance level, before Bitcoin halving.
Bitcoin (BTC) ha mostrado una tendencia alcista en el reciente análisis de precios semanal, encontrando constantemente un fuerte soporte por encima de la marca de los $70,000. Esta sólida base prepara el escenario para un movimiento ascendente anticipado hacia un nivel de resistencia de $75,000, antes de que Bitcoin se reduzca a la mitad.
Currently, Bitcoin stands at $70,805 after a slight surge from $68,000 levels. Bitcoin’s market capitalization crosses the $1.3 trillion threshold. Over the last week, Bitcoin has witnessed an increase of over 5% in value, signaling a robust positive momentum in the marketplace.
Actualmente, Bitcoin se sitúa en 70.805 dólares después de un ligero aumento desde los niveles de 68.000 dólares. La capitalización de mercado de Bitcoin cruza el umbral de 1,3 billones de dólares. Durante la última semana, Bitcoin ha sido testigo de un aumento de más del 5% en valor, lo que indica un sólido impulso positivo en el mercado.
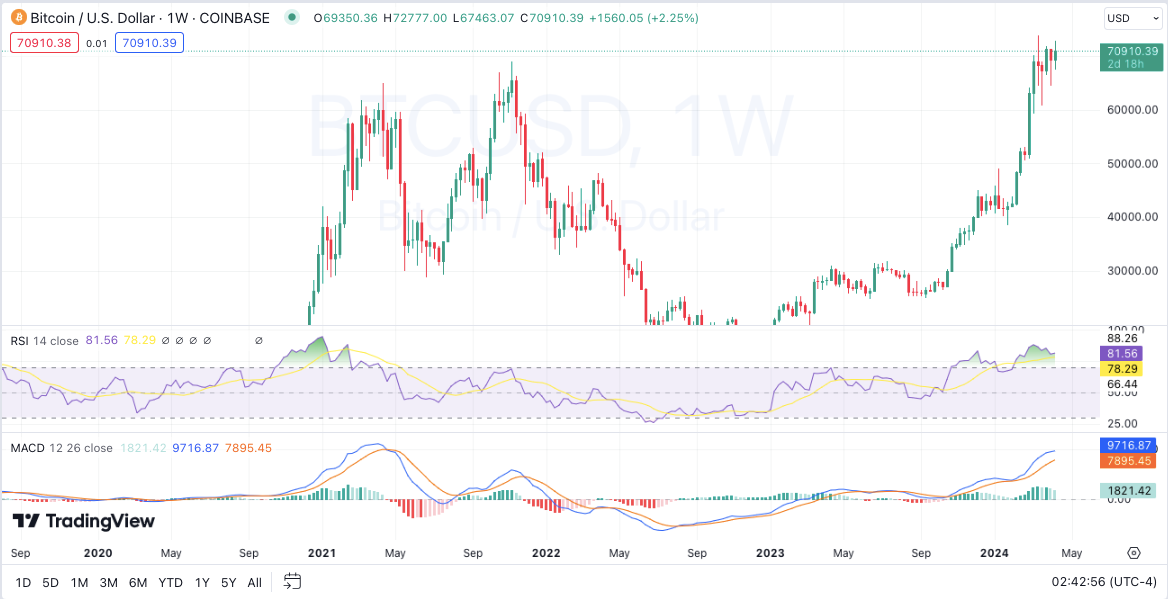
Bitcoin price chart: TradingView
Gráfico de precios de Bitcoin: TradingView
Technical indicators further reinforce the optimistic outlook for the BTC/USD pair, with a majority signaling a buy. The Relative Strength Index (RSI) demonstrates above-average readings, reflecting a potent buying pressure within the market.
Los indicadores técnicos refuerzan aún más las perspectivas optimistas para el par BTC/USD, y la mayoría señala una compra. El índice de fuerza relativa (RSI) muestra lecturas superiores al promedio, lo que refleja una potente presión de compra dentro del mercado.
Additionally, the Moving Averages Convergence Divergence (MACD) indicator has experienced a bullish crossover, suggesting the potential onset of a new bull market phase. The 20-SMA and 50-SMA underscore this bullish trend, with the 20-SMA providing sturdy support for Bitcoin’s price.
Además, el indicador de convergencia y divergencia de medias móviles (MACD) ha experimentado un cruce alcista, lo que sugiere el inicio potencial de una nueva fase del mercado alcista. La SMA 20 y la SMA 50 subrayan esta tendencia alcista, y la SMA 20 proporciona un sólido soporte para el precio de Bitcoin.
Ethereum (ETH)
Etereum (ETH)
Ethereum (ETH), the market’s second behemoth, mirrors this bullish sentiment, having peaked at over $3500 in the last week. The demand for ETH has been markedly strong, with the cryptocurrency securing more than a 8% gain within the same period.
Ethereum (ETH), el segundo gigante del mercado, refleja este sentimiento alcista, habiendo alcanzado un máximo de más de $3500 en la última semana. La demanda de ETH ha sido notablemente fuerte, y la criptomoneda obtuvo una ganancia de más del 8% en el mismo período.
Ethereum’s current trading price is $3,535, with a slight dip of 2.26% in the past 24 hours. With a market capitalization exceeding $424 billion, Ethereum is the second-largest digital currency in terms of market cap.
El precio de negociación actual de Ethereum es de 3.535 dólares, con una ligera caída del 2,26% en las últimas 24 horas. Con una capitalización de mercado superior a los 424 mil millones de dólares, Ethereum es la segunda moneda digital más grande en términos de capitalización de mercado.
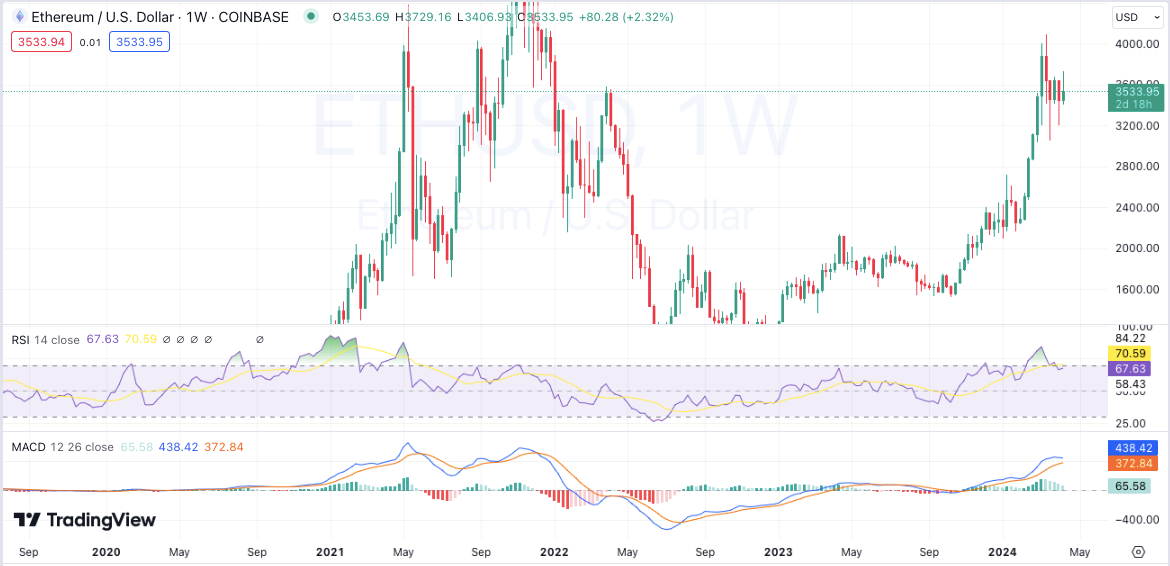
Ethereum price chart: TradingView
Gráfico de precios de Ethereum: TradingView
The technical landscape for ETH/USD is equally promising, with key indicators aligning on the bullish side of the spectrum. The RSI stands above the 67 mark, indicating vigorous market demand.
El panorama técnico para el ETH/USD es igualmente prometedor, con indicadores clave alineados en el lado alcista del espectro. El RSI se sitúa por encima de la marca 67, lo que indica una vigorosa demanda del mercado.
The MACD’s bullish crossover points towards a continuing positive trend for Ethereum. Moreover, the 20-EMA and 50-EMA serve as significant support levels, bolstering Ethereum’s bullish posture in the market.
El cruce alcista del MACD apunta hacia una tendencia positiva continua para Ethereum. Además, 20-EMA y 50-EMA sirven como niveles de soporte importantes, lo que refuerza la postura alcista de Ethereum en el mercado.
Binance Coin (BNB)
Moneda Binance (BNB)
Binance Coin (BNB), the proprietary digital asset of the globally recognized Binance exchange, has showcased a bullish pattern over the recent week, reaching heights surpassing $600. The market’s demand for BNB has been notably robust, resulting in a valuation increase of over 9% within the last seven days.
Binance Coin (BNB), el activo digital patentado del mundialmente reconocido intercambio Binance, ha mostrado un patrón alcista durante la última semana, alcanzando alturas que superan los $600. La demanda de BNB por parte del mercado ha sido notablemente sólida, lo que ha resultado en un aumento de valoración de más del 9% en los últimos siete días.
Presently, Binance Coin’s market capitalization stands impressively over $93 billion, positioning it as the fourth-largest cryptocurrency by market size. BNB’s trading price is $625, marking a 2.96% increase in the past 24 hours.
Actualmente, la capitalización de mercado de Binance Coin supera los 93 mil millones de dólares, lo que la posiciona como la cuarta criptomoneda más grande por tamaño de mercado. El precio de negociación de BNB es de 625 dólares, lo que supone un aumento del 2,96% en las últimas 24 horas.
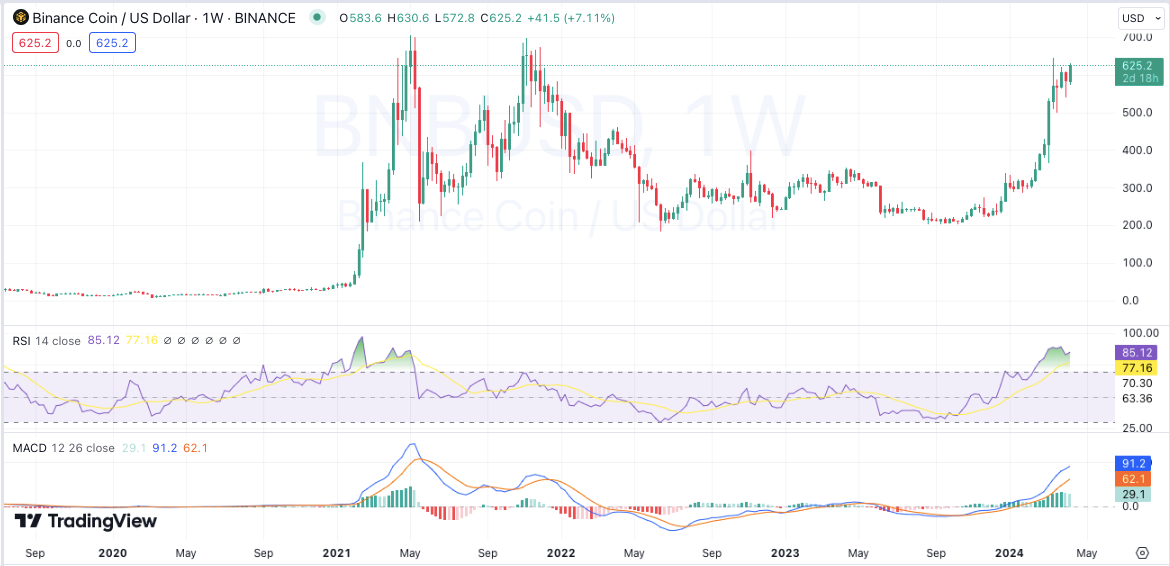
Binance price chart: Tradingview
Gráfico de precios de Binance: Tradingview
Technical indicators for the BNB/USD pairing suggest a trajectory for continued upward movement, with a consensus among indicators leaning towards a buy position. The Awesome Oscillator’s position above the zero line signals a continuing bullish momentum for Binance Coin.
Los indicadores técnicos para el par BNB/USD sugieren una trayectoria de movimiento ascendente continuo, con un consenso entre los indicadores que se inclinan hacia una posición de compra. La posición del Awesome Oscillator por encima de la línea cero indica un impulso alcista continuo para Binance Coin.
Additionally, the 20-SMA and 50-SMA serve as pivotal support levels that may catalyze the asset toward encountering new resistance thresholds. Both the RSI and MACD indicators align with a bullish future for BNB.
Además, las SMA 20 y SMA 50 sirven como niveles de soporte fundamentales que pueden catalizar el activo hacia nuevos umbrales de resistencia. Tanto el indicador RSI como el MACD se alinean con un futuro alcista para BNB.
Solana (SOL)
Solana (SOL)
Solana (SOL), marking its presence as one of the standout performers over the past week, has witnessed its price surge beyond $170, with a market correction from $180 levels. This altcoin has been on a bullish ascent, bolstered by increasing purchasing pressure and setting new yearly highs. Currently, Solana is priced at $174, with a notable small decrease of 0.4% decrease over the last week and a monthly upturn of 13%.
Solana (SOL), marcando su presencia como uno de los actores más destacados durante la semana pasada, ha sido testigo de un aumento de precios más allá de los 170 dólares, con una corrección del mercado desde los niveles de 180 dólares. Esta altcoin ha experimentado un ascenso alcista, impulsada por una creciente presión de compra y estableciendo nuevos máximos anuales. Actualmente, Solana tiene un precio de 174 dólares, con una pequeña disminución notable del 0,4% durante la última semana y un repunte mensual del 13%.
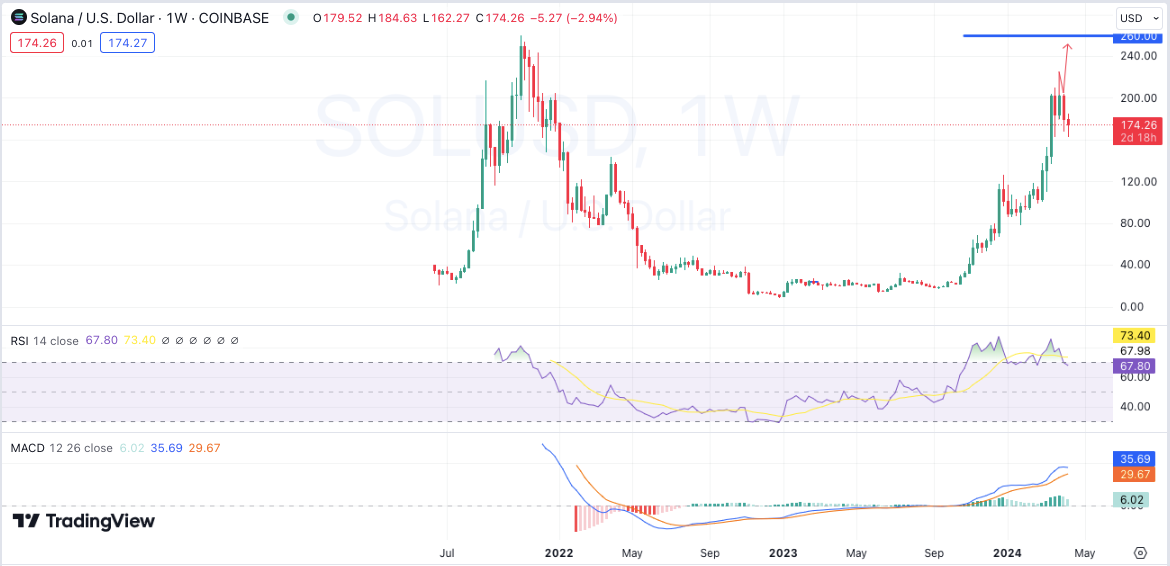
Solana price chart: Tradingview
Gráfico de precios de Solana: Tradingview
Continued bullish momentum could see SOL challenging the $200 resistance level. Conversely, should the Bears stage a comeback, Solana will find substantial support at the $170 threshold. The technical outlook for SOL/USD hints at a promising uptrend, with most indicators advocating a buy. Venturing into the overbought territory, the RSI signifies intense market interest in Solana. The MACD echoes this bullish sentiment, while the 20-MA supports SOL’s current market position.
El impulso alcista continuo podría hacer que SOL desafíe el nivel de resistencia de $ 200. Por el contrario, si los osos regresan, Solana encontrará un soporte sustancial en el umbral de $ 170. La perspectiva técnica para SOL/USD insinúa una tendencia alcista prometedora, y la mayoría de los indicadores abogan por una compra. Al aventurarse en el territorio de sobrecompra, el RSI indica un intenso interés del mercado en Solana. El MACD se hace eco de este sentimiento alcista, mientras que el 20-MA respalda la posición actual de SOL en el mercado.
XRP
XRP
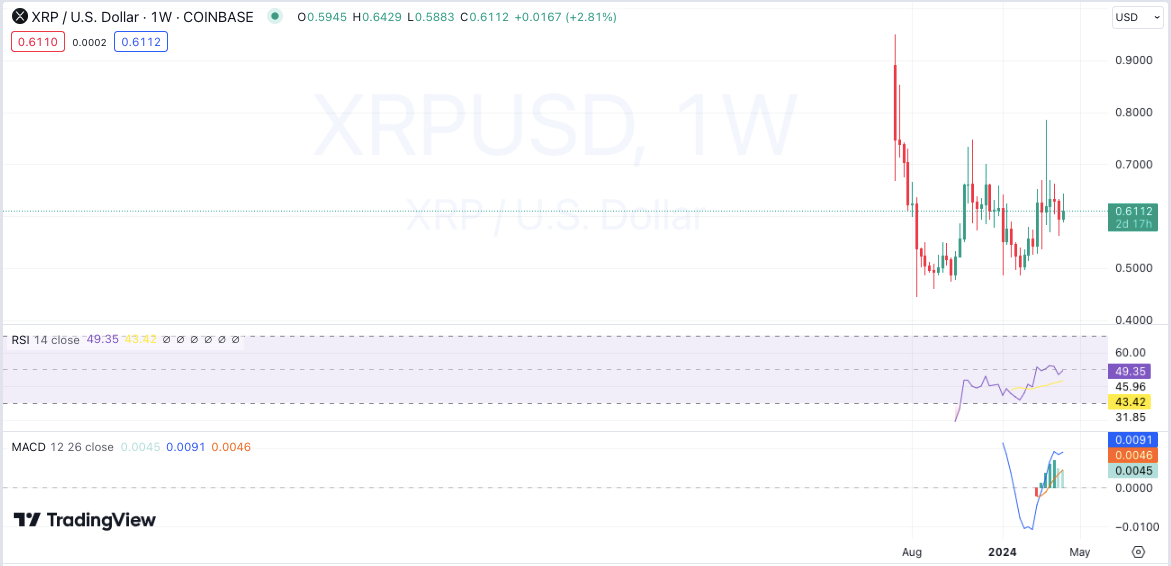
XRP has recently embarked on a bullish journey after spending most of March below the $0.65 mark. The XRP/USD pair broke past this level, oscillating around the $0.58 resistance point. The past week saw XRP amassing a growth of approximately 4%, with its current trading value at $0.6113.
XRP se ha embarcado recientemente en un viaje alcista después de pasar la mayor parte de marzo por debajo de la marca de 0,65 dólares. El par XRP/USD superó este nivel, oscilando alrededor del punto de resistencia de $0,58. La semana pasada, XRP acumuló un crecimiento de aproximadamente el 4%, con su valor comercial actual de 0,6113 dólares.
XRP price chart: Tradingview
Gráfico de precios de XRP: Tradingview
If XRP’s momentum is sustained, breaking through the $0.63 barrier might set its sights on reaching $0.65, though this level presents a formidable challenge. For bears to regain dominance, they must depress the price below the $0.62 mark. Analytical indicators, including moving averages and oscillators for XRP/USD, endorse a bullish stance, with the majority signaling a buy.
Si el impulso de XRP se mantiene, superar la barrera de los 0,63 dólares podría apuntar a alcanzar los 0,65 dólares, aunque este nivel presenta un desafío formidable. Para que los bajistas recuperen el dominio, deben bajar el precio por debajo de la marca de 0,62 dólares. Los indicadores analíticos, incluidos los promedios móviles y los osciladores del XRP/USD, respaldan una postura alcista, y la mayoría indica una compra.
The Relative Strength Index, below 70, underscores the strong market demand for XRP. The MACD indicator’s bullish crossover hints at the potential for further price ascension, with the 20-day EMA and 50-day SMA reinforcing XRP’s support base.
El índice de fuerza relativa, por debajo de 70, subraya la fuerte demanda del mercado de XRP. El cruce alcista del indicador MACD insinúa el potencial de una mayor subida de precios, con la EMA de 20 días y la SMA de 50 días reforzando la base de soporte de XRP.
Cardano(ADA)
Cardano(ADA)
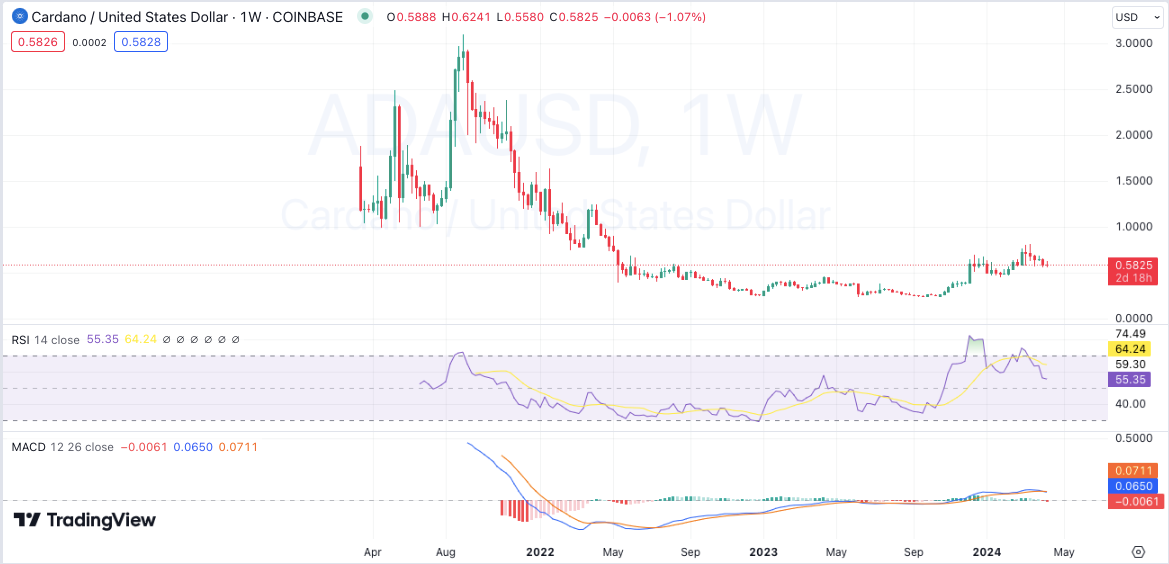
Weekly crypto market analysis shows that ADA/USD has been trading bullish over the past week, with green candlestick patterns dominating the charts. The token has gained more than 2% in value over the past seven days, reaching a high of over $0.62. ADA is trading at $0.5834, with a market capitalization of over $20 billion.
El análisis semanal del mercado de cifrado muestra que ADA/USD ha estado cotizando alcista durante la semana pasada, con patrones de velas verdes dominando los gráficos. El token ha ganado más del 2% en valor en los últimos siete días, alcanzando un máximo de más de 0,62 dólares. ADA cotiza a 0,5834 dólares, con una capitalización de mercado de más de 20 mil millones de dólares.
Cardano price chart: Tradingview
Gráfico de precios de Cardano: Tradingview
Technical indicators for ADA/USD also support a bullish outlook, with most indicators showing a buy signal. The RSI is hovering above 50, indicating a strong buying pressure in the market. The MACD indicator has also formed a bullish crossover, showing potential for further upside in price. The 20-MA and 50-MA are acting as strong support levels for ADA.
Los indicadores técnicos para ADA/USD también respaldan una perspectiva alcista, y la mayoría de los indicadores muestran una señal de compra. El RSI ronda los 50, lo que indica una fuerte presión de compra en el mercado. El indicador MACD también ha formado un cruce alcista, mostrando potencial para un mayor aumento del precio. 20-MA y 50-MA actúan como fuertes niveles de soporte para ADA.
Dogecoin(DOGE)
Dogecoin(DOGE)
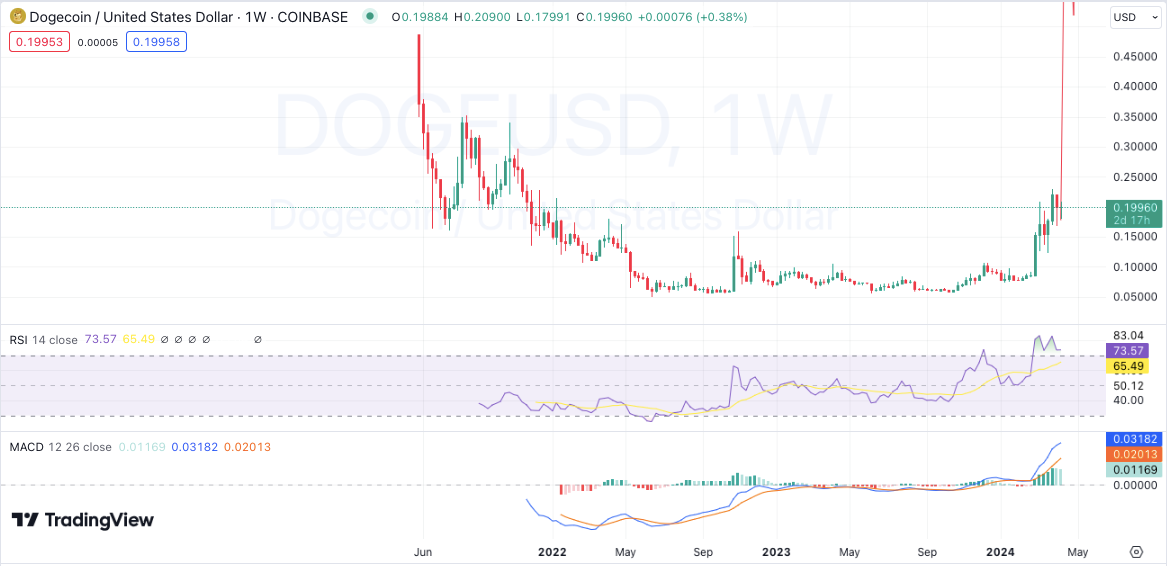
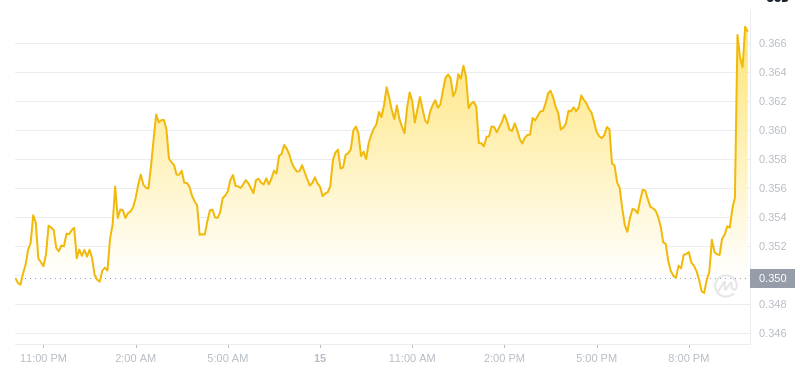
Dogecoin (DOGE), the meme-based cryptocurrency, has seen an impressive surge in price in the past week. Dogecoin has been trading above $0.2 for the past few weeks, with a robust surge of more than 1.20%, making it the best meme coin. Currently, the Dogecoin is at $0.2001, with a 24-hour increase of 3 percent.
Dogecoin (DOGE), la criptomoneda basada en memes, experimentó un impresionante aumento de precio la semana pasada. Dogecoin ha estado cotizando por encima de los 0,2 dólares durante las últimas semanas, con un fuerte aumento de más del 1,20%, lo que la convierte en la mejor moneda meme. Actualmente, el Dogecoin está a 0,2001 dólares, con un aumento del 3 por ciento en 24 horas.
Dogecoin price chart: Tradingview
Gráfico de precios de Dogecoin: Tradingview
The technical indicators for DOGE also support a bullish sentiment. The MACD indicator has shown a bullish crossover, indicating strong buying pressure in the market. The RSI is hovering above 70 levels, indicating bullish momentum. The 20-day EMA is also above the 50-day SMA, supporting a bullish trend.
Los indicadores técnicos de DOGE también respaldan un sentimiento alcista. El indicador MACD ha mostrado un cruce alcista, lo que indica una fuerte presión de compra en el mercado. El RSI ronda los 70 niveles, lo que indica un impulso alcista. La EMA de 20 días también está por encima de la SMA de 50 días, lo que respalda una tendencia alcista.
Weekly crypto price analysis conclusion
Conclusión del análisis semanal de precios de criptomonedas
Weekly crypto price analysis of popular digital assets shows that most are showing bullish signs and may surge to new all-time highs soon. The green candlestick pattern on the weekly charts also suggests that buyers are in control and may continue to push prices higher. Technical indicators also support a bullish outlook, with buying pressure expected to continue in the coming weeks.
El análisis semanal del precio de las criptomonedas de activos digitales populares muestra que la mayoría está mostrando signos alcistas y pronto pueden alcanzar nuevos máximos históricos. El patrón de velas verdes en los gráficos semanales también sugiere que los compradores tienen el control y pueden seguir haciendo subir los precios. Los indicadores técnicos también respaldan una perspectiva alcista y se espera que la presión de compra continúe en las próximas semanas.


 InsideBitcoin News
 Crypto Intelligence
 CoinPedia News
 CFN
CFN The Bit Journal
 DogeHome
 CoinPedia News
 Crypto News Flash
 The Bit Journal


