Weekly crypto price analysis for major tokens such as Bitcoin( BTC), Ethereum (ETH), Binance(BNB), Solana(SOL), XRP, Cardano(ADA), and Dogecoin(DOGE) shows a promising outlook for the market. Most digital assets display positive momentum and challenging resistance levels, with slight correction over the past 24-hours.
비트코인(BTC), 이더리움(ETH), 바이낸스(BNB), 솔라나(SOL), XRP, Cardano(ADA), Dogecoin(DOGE) 등 주요 토큰에 대한 주간 암호화폐 가격 분석은 시장에 대한 유망한 전망을 보여줍니다. 대부분의 디지털 자산은 지난 24시간 동안 약간의 조정을 거쳐 긍정적인 모멘텀과 도전적인 저항 수준을 나타냅니다.
Leading the pack, Bitcoin (BTC) has successfully maintained its position above the $70,000 mark, showing signs of a bullish momentum that could potentially elevate its value to the $75,000 threshold, making a two-year high. The broader market has mirrored this positive trend, with significant buying interest observed across several key cryptocurrencies.
선두를 달리고 있는 비트코인(BTC)은 70,000달러 이상의 위치를 성공적으로 유지했으며, 잠재적으로 그 가치를 75,000달러 임계값까지 끌어올려 2년 최고치를 기록할 수 있는 강세 모멘텀의 조짐을 보여주었습니다. 더 넓은 시장은 이러한 긍정적인 추세를 반영했으며, 여러 주요 암호화폐에서 상당한 구매 관심이 관찰되었습니다.
Bitcoin (BTC) has kicked off the week on a positive note, attempting to stay above the $75,000 mark. The waiting anticipation around the Bitcoin halving event this month adds fuel to the bullish outlook for BTC and many other cryptocurrencies.
비트코인(BTC)은 75,000달러 이상을 유지하기 위해 긍정적인 분위기로 한 주를 시작했습니다. 이번 달 비트코인 반감기 행사에 대한 기대는 BTC 및 기타 많은 암호화폐에 대한 낙관적인 전망을 더욱 부채질합니다.
Investors and traders alike are gearing up for potential upward movements, as historically, halving events have led to significant price increases due to the reduced supply of new Bitcoins entering the market.
투자자와 거래자 모두 잠재적인 상승 움직임에 대비하고 있습니다. 역사적으로 반감기 이벤트는 시장에 진입하는 새로운 비트코인의 공급 감소로 인해 상당한 가격 상승으로 이어졌기 때문입니다.
The broader market has mirrored this positive trend, with significant buying interest observed across several key cryptocurrencies. Crypto exchanges are having a frenzy with cryptocurrency trading.
더 넓은 시장은 이러한 긍정적인 추세를 반영했으며, 여러 주요 암호화폐에서 상당한 구매 관심이 관찰되었습니다. 암호화폐 거래소는 암호화폐 거래에 열광하고 있습니다.
Ethereum (ETH), holding the title of the second-largest digital currency by market cap, has not been left behind. The past week saw Ethereum breach the $3,500 barrier, a bullish signal reinforcing the positive market sentiment. Similarly, Binance Coin (BNB) has shown remarkable stability, consistently trading above $600 and inching closer to overcoming the $630 resistance mark.
시가총액 기준 두 번째로 큰 디지털 화폐 타이틀을 보유한 이더리움(ETH)도 뒤처지지 않았습니다. 지난 주에는 이더리움이 3,500달러 장벽을 돌파했는데, 이는 긍정적인 시장 정서를 강화하는 강세 신호였습니다. 마찬가지로, 바이낸스 코인(BNB)은 꾸준히 600달러 이상으로 거래되고 630달러 저항선을 극복하는 데 조금씩 가까워지는 놀라운 안정성을 보여주었습니다.
Solana (SOL), known for its efficiency and lower transaction costs, has emerged as one of the monthly standout performers, with its price soaring past $170. XRP has also enjoyed a week of gains, climbing by over 4% and trading above $0.61. This upward movement has sparked conversations about its potential to reach the $0.7 mark. Cardano (ADA) and Dogecoin (DOGE) are not far behind, with ADA appreciating by more than 2% and DOGE gaining more than 13%, reflecting a strong bullish trend in the meme coin sector.
효율성과 낮은 거래 비용으로 유명한 솔라나(SOL)는 가격이 170달러를 넘으며 월간 뛰어난 성과를 내는 업체 중 하나로 떠올랐습니다. XRP는 또한 일주일 동안 4% 이상 상승하고 0.61달러 이상 거래되는 등 상승세를 누렸습니다. 이러한 상승 움직임은 0.7달러에 도달할 가능성에 대한 대화를 촉발시켰습니다. Cardano(ADA)와 Dogecoin(DOGE)은 크게 뒤처지지 않습니다. ADA는 2% 이상, DOGE는 13% 이상 상승하여 밈 코인 부문의 강력한 강세 추세를 반영합니다.
Bitcoin(BTC)
비트코인(BTC)
Bitcoin (BTC) has shown a bullish trend in the recent weekly price analysis, consistently finding strong support above the $70,000 mark. This solid foundation sets the stage for an anticipated upward movement toward a $75,000 resistance level, before Bitcoin halving.
비트코인(BTC)은 최근 주간 가격 분석에서 강세 추세를 보이며 지속적으로 70,000달러 이상의 강력한 지지를 확인했습니다. 이 탄탄한 기반은 비트코인이 반감되기 전에 75,000달러 저항 수준을 향해 예상되는 상승 움직임의 발판을 마련합니다.
Currently, Bitcoin stands at $70,805 after a slight surge from $68,000 levels. Bitcoin’s market capitalization crosses the $1.3 trillion threshold. Over the last week, Bitcoin has witnessed an increase of over 5% in value, signaling a robust positive momentum in the marketplace.
현재 비트코인은 68,000달러 수준에서 소폭 상승한 후 70,805달러에 머물고 있습니다. 비트코인의 시가총액은 1조 3천억 달러의 문턱을 넘었습니다. 지난 주 동안 비트코인은 가치가 5% 이상 증가하여 시장에서 강력한 긍정적 모멘텀을 나타냈습니다.
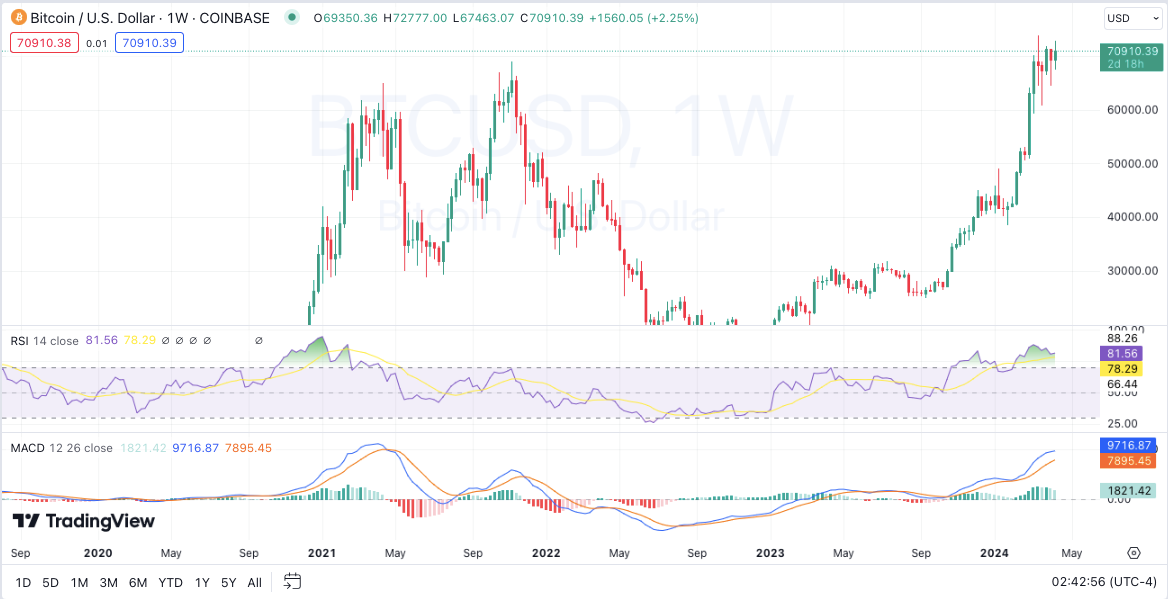
Bitcoin price chart: TradingView
비트코인 가격 차트: TradingView
Technical indicators further reinforce the optimistic outlook for the BTC/USD pair, with a majority signaling a buy. The Relative Strength Index (RSI) demonstrates above-average readings, reflecting a potent buying pressure within the market.
기술 지표는 대다수가 매수 신호를 보내면서 BTC/USD 쌍에 대한 낙관적인 전망을 더욱 강화합니다. 상대강도지수(RSI)는 평균 이상의 수치를 보여 시장 내 강력한 구매 압력을 반영합니다.
Additionally, the Moving Averages Convergence Divergence (MACD) indicator has experienced a bullish crossover, suggesting the potential onset of a new bull market phase. The 20-SMA and 50-SMA underscore this bullish trend, with the 20-SMA providing sturdy support for Bitcoin’s price.
또한 MACD(Moving Averages Convergence Divergence) 지표는 강세 교차를 경험하여 새로운 강세장 국면이 시작될 가능성이 있음을 시사합니다. 20-SMA와 50-SMA는 이러한 강세 추세를 강조하며 20-SMA는 비트코인 가격에 대한 견고한 지원을 제공합니다.
Ethereum (ETH)
이더리움(ETH)
Ethereum (ETH), the market’s second behemoth, mirrors this bullish sentiment, having peaked at over $3500 in the last week. The demand for ETH has been markedly strong, with the cryptocurrency securing more than a 8% gain within the same period.
시장의 두 번째 거대 기업인 이더리움(ETH)은 지난 주 3,500달러 이상으로 정점을 찍으며 이러한 낙관적인 분위기를 반영합니다. ETH에 대한 수요는 눈에 띄게 강해졌으며 암호화폐는 같은 기간 동안 8% 이상의 이익을 얻었습니다.
Ethereum’s current trading price is $3,535, with a slight dip of 2.26% in the past 24 hours. With a market capitalization exceeding $424 billion, Ethereum is the second-largest digital currency in terms of market cap.
이더리움의 현재 거래 가격은 3,535달러이며 지난 24시간 동안 2.26% 소폭 하락했습니다. 시가총액이 4,240억 달러를 초과하는 이더리움은 시가총액 기준으로 두 번째로 큰 디지털 통화입니다.
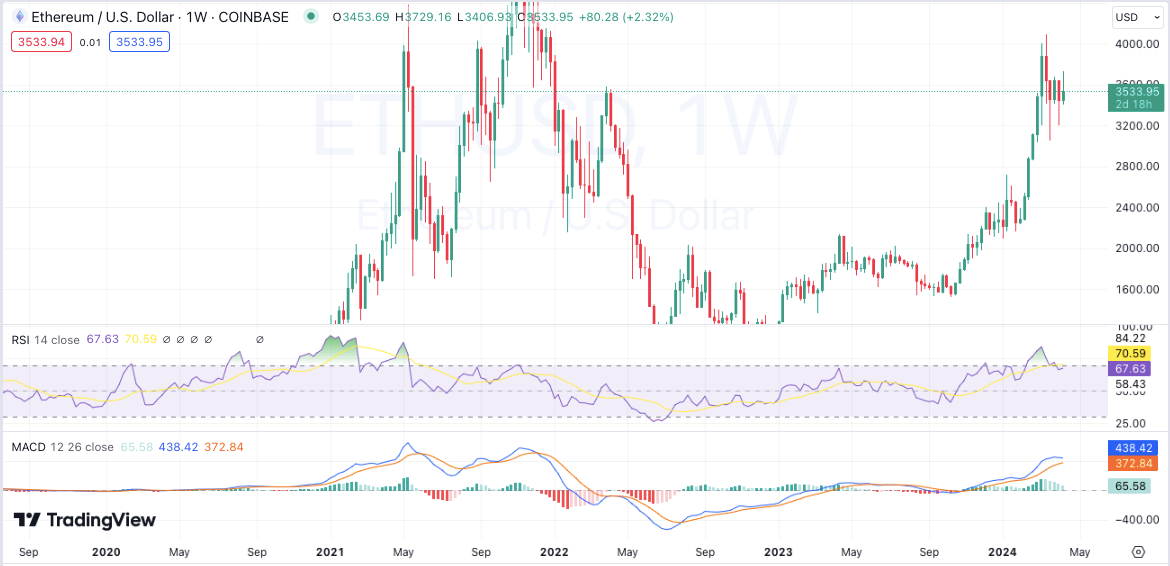
Ethereum price chart: TradingView
이더리움 가격 차트: TradingView
The technical landscape for ETH/USD is equally promising, with key indicators aligning on the bullish side of the spectrum. The RSI stands above the 67 mark, indicating vigorous market demand.
ETH/USD의 기술 환경도 똑같이 유망하며 주요 지표가 스펙트럼의 강세 측면에 정렬되어 있습니다. RSI는 67을 넘어 활발한 시장 수요를 나타냅니다.
The MACD’s bullish crossover points towards a continuing positive trend for Ethereum. Moreover, the 20-EMA and 50-EMA serve as significant support levels, bolstering Ethereum’s bullish posture in the market.
MACD의 강세 교차는 이더리움의 지속적인 긍정적 추세를 가리킵니다. 게다가 20-EMA와 50-EMA는 상당한 지원 수준을 제공하여 시장에서 이더리움의 낙관적인 입지를 강화합니다.
Binance Coin (BNB)
바이낸스 코인(BNB)
Binance Coin (BNB), the proprietary digital asset of the globally recognized Binance exchange, has showcased a bullish pattern over the recent week, reaching heights surpassing $600. The market’s demand for BNB has been notably robust, resulting in a valuation increase of over 9% within the last seven days.
세계적으로 인정받는 바이낸스 거래소의 독점 디지털 자산인 바이낸스 코인(BNB)은 최근 한 주 동안 강세 패턴을 보여 600달러를 넘는 높이에 도달했습니다. BNB에 대한 시장 수요는 눈에 띄게 견고해 지난 7일 동안 가치 평가가 9% 이상 증가했습니다.
Presently, Binance Coin’s market capitalization stands impressively over $93 billion, positioning it as the fourth-largest cryptocurrency by market size. BNB’s trading price is $625, marking a 2.96% increase in the past 24 hours.
현재 바이낸스 코인의 시가총액은 930억 달러를 넘어 시장 규모 기준으로 네 번째로 큰 암호화폐로 자리매김하고 있습니다. BNB의 거래 가격은 625달러로 지난 24시간 동안 2.96% 상승했습니다.
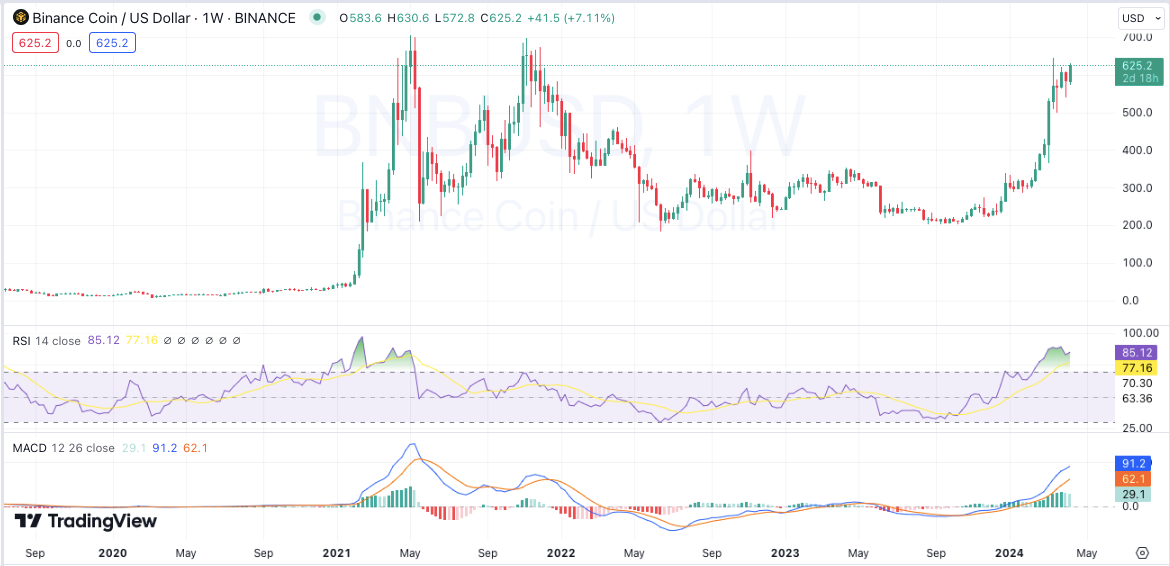
Binance price chart: Tradingview
바이낸스 가격 차트: Tradingview
Technical indicators for the BNB/USD pairing suggest a trajectory for continued upward movement, with a consensus among indicators leaning towards a buy position. The Awesome Oscillator’s position above the zero line signals a continuing bullish momentum for Binance Coin.
BNB/USD 쌍에 대한 기술적 지표는 지속적인 상승 움직임의 궤적을 제시하며, 지표들 간의 합의는 매수 포지션으로 기울고 있습니다. 제로 라인 위의 Awesome Oscillator 위치는 바이낸스 코인의 지속적인 강세 모멘텀을 나타냅니다.
Additionally, the 20-SMA and 50-SMA serve as pivotal support levels that may catalyze the asset toward encountering new resistance thresholds. Both the RSI and MACD indicators align with a bullish future for BNB.
또한 20-SMA 및 50-SMA는 자산이 새로운 저항 임계값에 직면하도록 촉진할 수 있는 중추적인 지원 수준 역할을 합니다. RSI와 MACD 지표 모두 BNB의 낙관적인 미래와 일치합니다.
Solana (SOL)
솔라나 (SUN)
Solana (SOL), marking its presence as one of the standout performers over the past week, has witnessed its price surge beyond $170, with a market correction from $180 levels. This altcoin has been on a bullish ascent, bolstered by increasing purchasing pressure and setting new yearly highs. Currently, Solana is priced at $174, with a notable small decrease of 0.4% decrease over the last week and a monthly upturn of 13%.
지난 주 뛰어난 실적을 보인 솔라나(SOL)는 가격이 170달러를 넘어 급등했으며 시장은 180달러 수준에서 조정되었습니다. 이 알트코인은 구매 압력이 증가하고 연간 최고치를 경신함으로써 강세를 보이고 있습니다. 현재 솔라나의 가격은 174달러로 지난 주에 비해 0.4% 하락했고 월간 상승률은 13%였습니다.
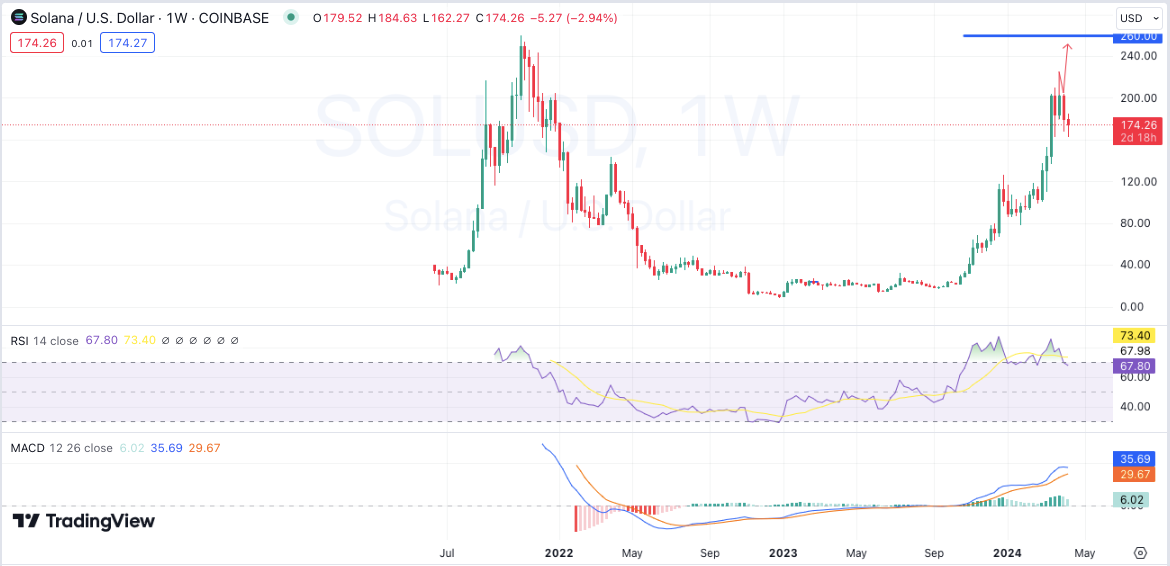
Solana price chart: Tradingview
솔라나 가격 차트: Tradingview
Continued bullish momentum could see SOL challenging the $200 resistance level. Conversely, should the Bears stage a comeback, Solana will find substantial support at the $170 threshold. The technical outlook for SOL/USD hints at a promising uptrend, with most indicators advocating a buy. Venturing into the overbought territory, the RSI signifies intense market interest in Solana. The MACD echoes this bullish sentiment, while the 20-MA supports SOL’s current market position.
지속적인 강세 모멘텀으로 인해 SOL이 $200 저항 수준에 도전할 수 있습니다. 반대로, Bears가 복귀한다면 Solana는 $170라는 한계점에서 상당한 지원을 받게 될 것입니다. SOL/USD의 기술적 전망은 유망한 상승 추세를 암시하며 대부분의 지표는 매수를 지지합니다. 과매수 영역으로 진입하는 RSI는 솔라나에 대한 시장의 강렬한 관심을 나타냅니다. MACD는 이러한 강세 정서를 반영하는 반면, 20일 이동평균선은 SOL의 현재 시장 지위를 뒷받침합니다.
XRP
XRP
XRP has recently embarked on a bullish journey after spending most of March below the $0.65 mark. The XRP/USD pair broke past this level, oscillating around the $0.58 resistance point. The past week saw XRP amassing a growth of approximately 4%, with its current trading value at $0.6113.
XRP는 3월 대부분을 0.65달러 이하로 보낸 후 최근 강세 여행을 시작했습니다. XRP/USD 쌍은 이 수준을 넘어 $0.58 저항점을 중심으로 진동했습니다. 지난 주 XRP는 약 4%의 성장을 보였으며 현재 거래 가치는 $0.6113입니다.
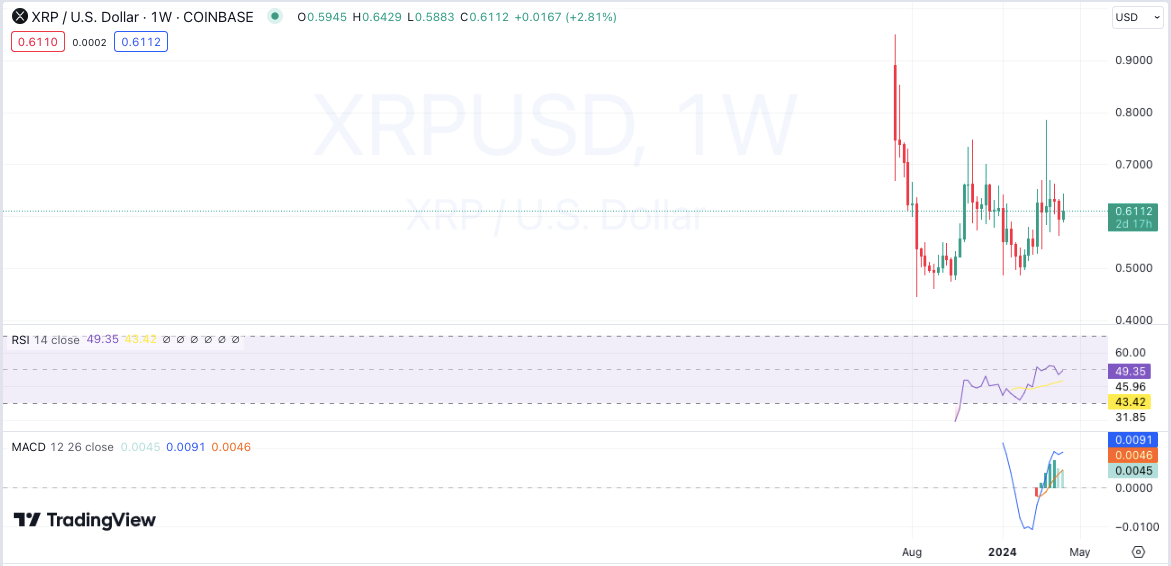
XRP price chart: Tradingview
XRP 가격 차트: Tradingview
If XRP’s momentum is sustained, breaking through the $0.63 barrier might set its sights on reaching $0.65, though this level presents a formidable challenge. For bears to regain dominance, they must depress the price below the $0.62 mark. Analytical indicators, including moving averages and oscillators for XRP/USD, endorse a bullish stance, with the majority signaling a buy.
XRP의 추진력이 지속된다면 0.63달러 장벽을 돌파하면 0.65달러에 도달하는 것이 목표가 될 수 있지만 이 수준은 엄청난 도전 과제입니다. 하락세가 다시 지배력을 되찾으려면 가격을 0.62달러 아래로 낮춰야 합니다. XRP/USD의 이동 평균 및 오실레이터를 포함한 분석 지표는 강세 입장을 지지하며 대다수는 매수 신호를 보냅니다.
The Relative Strength Index, below 70, underscores the strong market demand for XRP. The MACD indicator’s bullish crossover hints at the potential for further price ascension, with the 20-day EMA and 50-day SMA reinforcing XRP’s support base.
70 미만의 상대 강도 지수는 XRP에 대한 강력한 시장 수요를 강조합니다. MACD 지표의 강세 교차는 20일 EMA와 50일 SMA가 XRP의 지지 기반을 강화하면서 추가 가격 상승 가능성을 암시합니다.
Cardano(ADA)
카르다노(ADA)
Weekly crypto market analysis shows that ADA/USD has been trading bullish over the past week, with green candlestick patterns dominating the charts. The token has gained more than 2% in value over the past seven days, reaching a high of over $0.62. ADA is trading at $0.5834, with a market capitalization of over $20 billion.
주간 암호화폐 시장 분석에 따르면 ADA/USD는 지난 주 동안 강세 거래를 했으며 녹색 촛대 패턴이 차트를 지배하고 있는 것으로 나타났습니다. 토큰의 가치는 지난 7일 동안 2% 이상 상승하여 $0.62 이상의 최고치를 기록했습니다. ADA는 시가총액이 200억 달러가 넘는 0.5834달러에 거래되고 있습니다.
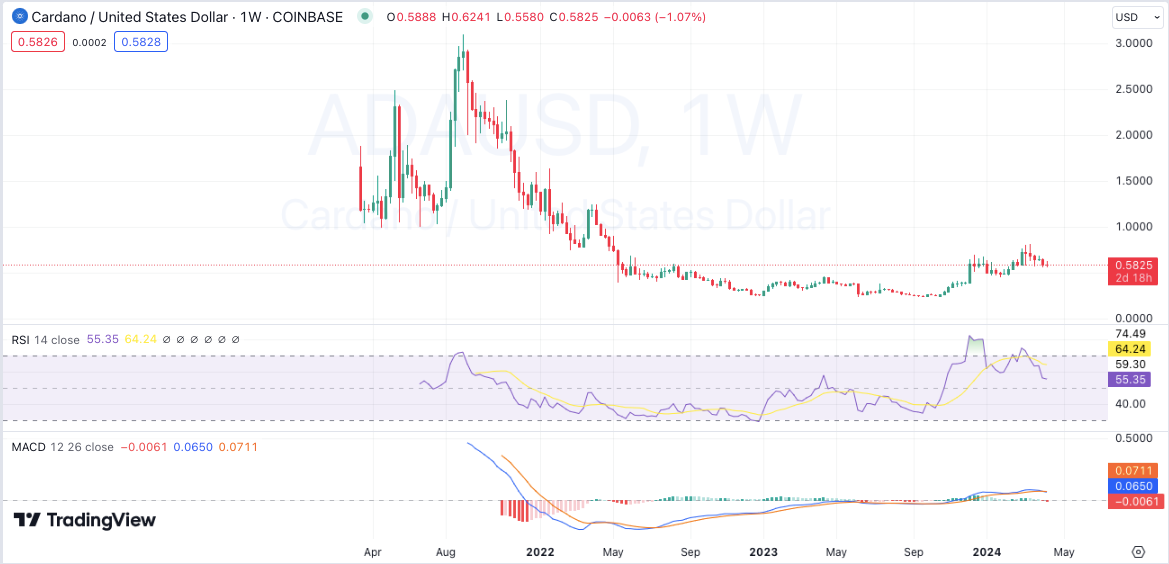
Cardano price chart: Tradingview
카르다노 가격 차트: Tradingview
Technical indicators for ADA/USD also support a bullish outlook, with most indicators showing a buy signal. The RSI is hovering above 50, indicating a strong buying pressure in the market. The MACD indicator has also formed a bullish crossover, showing potential for further upside in price. The 20-MA and 50-MA are acting as strong support levels for ADA.
ADA/USD에 대한 기술적 지표도 강세 전망을 뒷받침하며 대부분의 지표는 매수 신호를 나타냅니다. RSI가 50을 넘어서고 있어 시장에 강한 매수 압력이 있음을 나타냅니다. MACD 지표도 강세 교차를 형성하여 가격이 추가로 상승할 가능성이 있음을 보여줍니다. 20-MA와 50-MA는 ADA에 대한 강력한 지원 수준으로 작용하고 있습니다.
Dogecoin(DOGE)
도지코인(DOGE)
Dogecoin (DOGE), the meme-based cryptocurrency, has seen an impressive surge in price in the past week. Dogecoin has been trading above $0.2 for the past few weeks, with a robust surge of more than 1.20%, making it the best meme coin. Currently, the Dogecoin is at $0.2001, with a 24-hour increase of 3 percent.
밈 기반 암호화폐인 도지코인(DOGE)은 지난 주 인상적인 가격 급등을 보였습니다. Dogecoin은 지난 몇 주 동안 1.20% 이상의 강력한 상승세를 보이며 0.2달러 이상 거래되어 최고의 밈 코인이 되었습니다. 현재 Dogecoin은 0.2001달러로 24시간 동안 3% 상승했습니다.
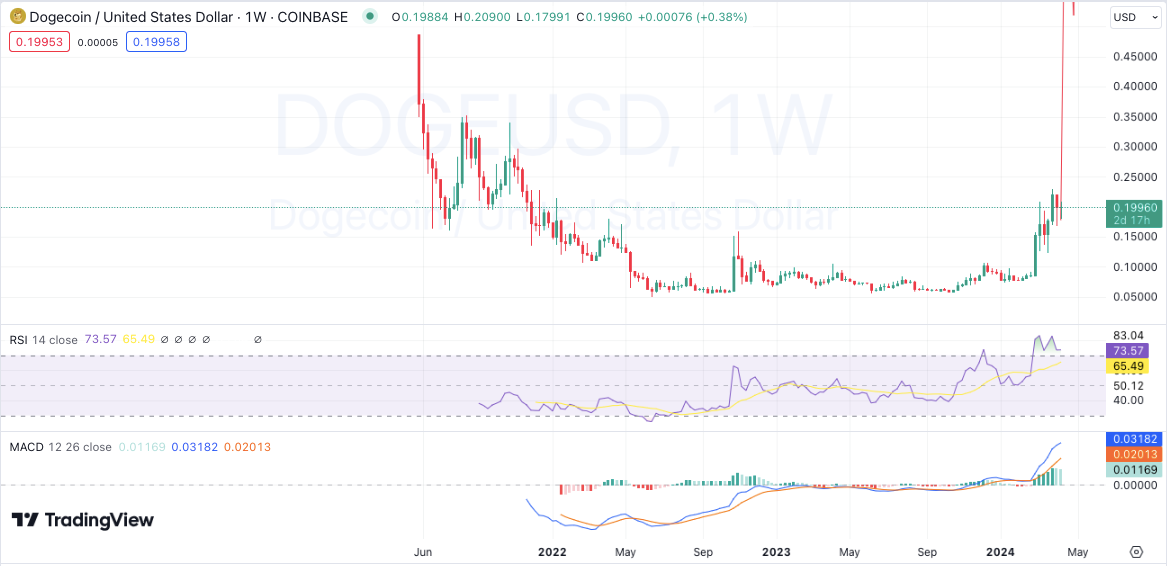
Dogecoin price chart: Tradingview
Dogecoin 가격 차트: Tradingview
The technical indicators for DOGE also support a bullish sentiment. The MACD indicator has shown a bullish crossover, indicating strong buying pressure in the market. The RSI is hovering above 70 levels, indicating bullish momentum. The 20-day EMA is also above the 50-day SMA, supporting a bullish trend.
DOGE의 기술 지표도 낙관적인 분위기를 뒷받침합니다. MACD 지표는 강세 교차를 보여 시장의 강한 매수 압력을 나타냅니다. RSI가 70선을 맴돌고 있어 강세 모멘텀을 나타냅니다. 20일 EMA도 50일 SMA보다 높아 강세 추세를 뒷받침하고 있습니다.
Weekly crypto price analysis conclusion
주간 암호화폐 가격 분석 결론
Weekly crypto price analysis of popular digital assets shows that most are showing bullish signs and may surge to new all-time highs soon. The green candlestick pattern on the weekly charts also suggests that buyers are in control and may continue to push prices higher. Technical indicators also support a bullish outlook, with buying pressure expected to continue in the coming weeks.
인기 있는 디지털 자산에 대한 주간 암호화폐 가격 분석에 따르면 대부분이 강세 신호를 보이고 있으며 곧 사상 최고치로 급등할 수 있습니다. 주간 차트의 녹색 촛대 패턴은 또한 구매자가 가격을 통제하고 계속해서 가격을 더 높일 수 있음을 나타냅니다. 기술적 지표도 낙관적인 전망을 뒷받침하고 있으며, 앞으로 몇 주 동안 매수 압력이 지속될 것으로 예상됩니다.


 DogeHome
 Cryptopolitan
 crypto.ro English
 Crypto News Land
 ETHNews
 CFN
CFN U_Today


