As the majority of assets in the cryptocurrency sector open another week on a bullish note, things are no different for Dogecoin (DOGE), Shiba Inu (SHIB), and Cardano (ADA). However, one indicator has suggested that the gains for some of the largest crypto assets by market capitalization might temporarily slow down.
Alors que la majorité des actifs du secteur des crypto-monnaies ouvrent une autre semaine sur une note haussière, les choses ne sont pas différentes pour Dogecoin (DOGE), Shiba Inu (SHIB) et Cardano (ADA). Cependant, un indicateur suggère que les gains de certains des plus grands actifs cryptographiques par capitalisation boursière pourraient temporairement ralentir.
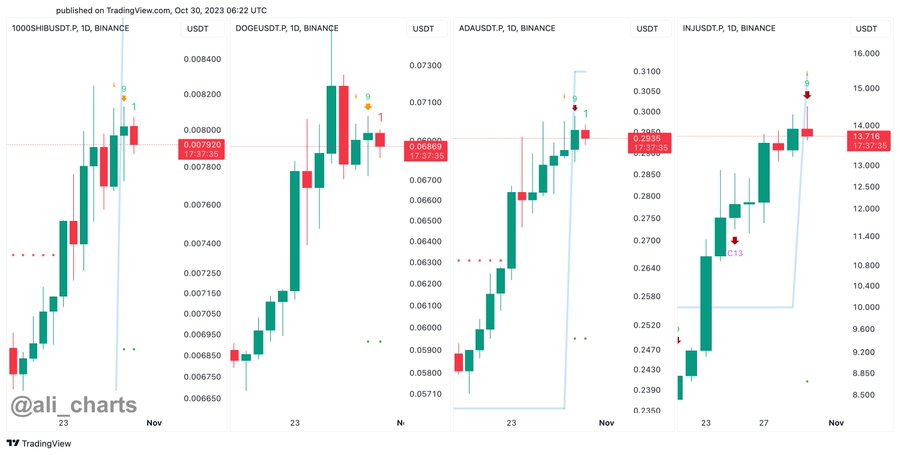
Specifically, crypto trading expert Ali Martinez observed that the TD Sequential indicator was demonstrating a sell signal on the daily chart for Cardano, Shiba Inu, Dogecoin, and Injective (INJ), suggesting that a correction could occur before they continue on the uptrend, as he said on October 30.
Plus précisément, l'expert en crypto trading Ali Martinez a observé que l'indicateur TD Sequential démontrait un signal de vente sur le graphique journalier pour Cardano, Shiba Inu, Dogecoin et Injective (INJ), suggérant qu'une correction pourrait se produire avant qu'ils ne poursuivent leur tendance haussière, car a-t-il déclaré le 30 octobre.
Indeed, created by market analyst Tom DeMark, the TD Sequential indicator is a technical Analysis (TA) tool that helps identify specific points at which an asset’s price might change direction. In other words, it assists in assessing continuation patterns and trend reversals in financial markets, including the crypto market.
En effet, créé par l’analyste de marché Tom DeMark, l’indicateur TD Sequential est un outil d’analyse technique (AT) qui permet d’identifier les points spécifiques auxquels le prix d’un actif pourrait changer de direction. En d’autres termes, il aide à évaluer les modèles de continuation et les inversions de tendance sur les marchés financiers, y compris le marché de la cryptographie.
SHIB price analysis
Analyse des prix SHIB
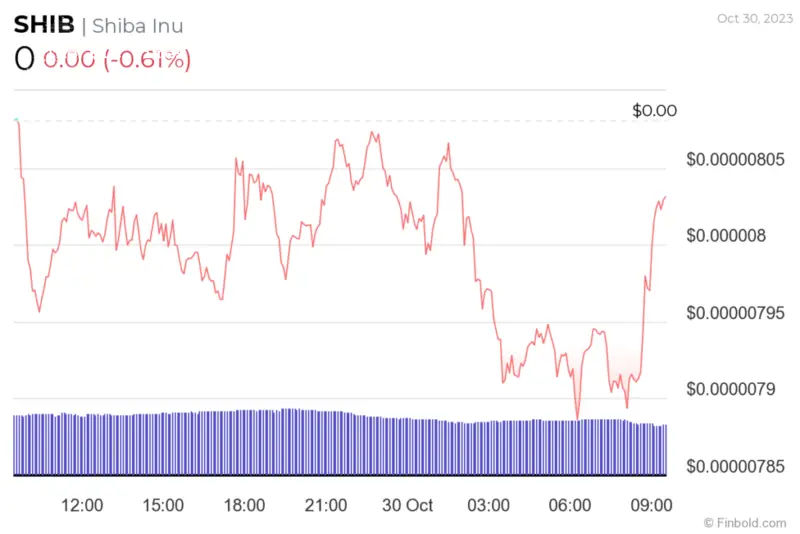
Meanwhile, Shiba Inu was at press time changing hands at the price of $0.00000803, which means it is down 0.61% on the day but is still recording growth of 10.51% and 9.75% on its weekly and monthly charts, respectively, according to the latest information retrieved on October 30.
Pendant ce temps, Shiba Inu changeait de mains au moment de la publication au prix de 0,00000803 $, ce qui signifie qu'il est en baisse de 0,61 % sur la journée, mais enregistre toujours une croissance de 10,51 % et 9,75 % sur ses graphiques hebdomadaires et mensuels, respectivement, selon le dernier. information récupérée le 30 octobre.

Crypto-monnaie
These 3 cryptocurrencies are reaping gains today
Ces 3 cryptomonnaies engrangent aujourd’hui des gains

Crypto-monnaie
AI predicts DOGE price for Halloween 2023
L'IA prédit le prix du DOGE pour Halloween 2023

Crypto-monnaie
3 cryptocurrencies to avoid next week
3 cryptomonnaies à éviter la semaine prochaine

Crypto-monnaie
5 cryptocurrencies under $0.10 to buy next week
5 crypto-monnaies à moins de 0,10 $ à acheter la semaine prochaine

Crypto-monnaie
Can Dogecoin reach $1?
Dogecoin peut-il atteindre 1 $ ?
It is also important to mention that the Shiba Inu developers have recently kick-started the countdown for the launch of a revolutionary SHIB identity on the blockchain, which promises to add more utility to the SHIB crypto asset and is part of the mission to incorporate Self-Sovereign Identity into all projects in the ecosystem, with potential to strengthen the price of this cryptocurrency.
Il est également important de mentionner que les développeurs de Shiba Inu ont récemment lancé le compte à rebours pour le lancement d'une identité SHIB révolutionnaire sur la blockchain, qui promet d'ajouter plus d'utilité à l'actif cryptographique SHIB et fait partie de la mission d'incorporation de Self. -Identité souveraine dans tous les projets de l'écosystème, avec le potentiel de renforcer le prix de cette crypto-monnaie.
DOGE price analysis
Analyse des prix DOGE
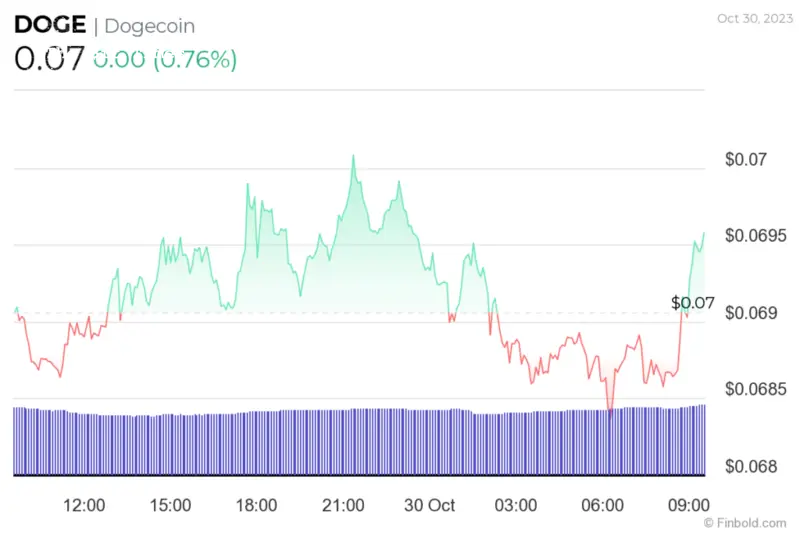
At the same time, Dogecoin was recording price gains on all of its observed charts, including an advance of 0.76% on the day, increasing 7.92% over the past week, and growing 12.43% on its monthly chart, currently trading at $0.06958, as the most recent information suggests.
Dans le même temps, Dogecoin enregistrait des gains de prix sur tous ses graphiques observés, y compris une avance de 0,76 % sur la journée, une augmentation de 7,92 % au cours de la semaine dernière et une croissance de 12,43 % sur son graphique mensuel, se négociant actuellement à 0,06958 $, comme suggèrent les informations les plus récentes.
Notably, DOGE has recently broken out of a multi-year descending triangle chart pattern on its weekly chart, which reinforced DOGE’s bullish outlook along with the “confirmation of a buy signal from the TD Sequential indicator within this timeframe,” as Martinez himself pointed out on October 29.
Notamment, DOGE a récemment rompu une configuration graphique en triangle descendant pluriannuel sur son graphique hebdomadaire, ce qui a renforcé les perspectives haussières de DOGE ainsi que la « confirmation d'un signal d'achat de l'indicateur séquentiel TD dans ce laps de temps », comme l'a souligné Martinez lui-même. le 29 octobre.
Cardano price analysis
Analyse des prix Cardano
Finally, Cardano was at press time changing hands at the price of $0.29757, which indicates an increase of 1.16% in the last 24 hours, adding up to the 12.22% gain across the previous seven days, as well as an advance of 18.64% over the past month, as the most recent charts show.
Enfin, au moment de mettre sous presse, Cardano changeait de mains au prix de 0,29757 $, ce qui indique une augmentation de 1,16 % au cours des dernières 24 heures, s'ajoutant au gain de 12,22 % au cours des sept jours précédents, ainsi qu'une avance de 18,64 % par rapport à le mois dernier, comme le montrent les graphiques les plus récents.
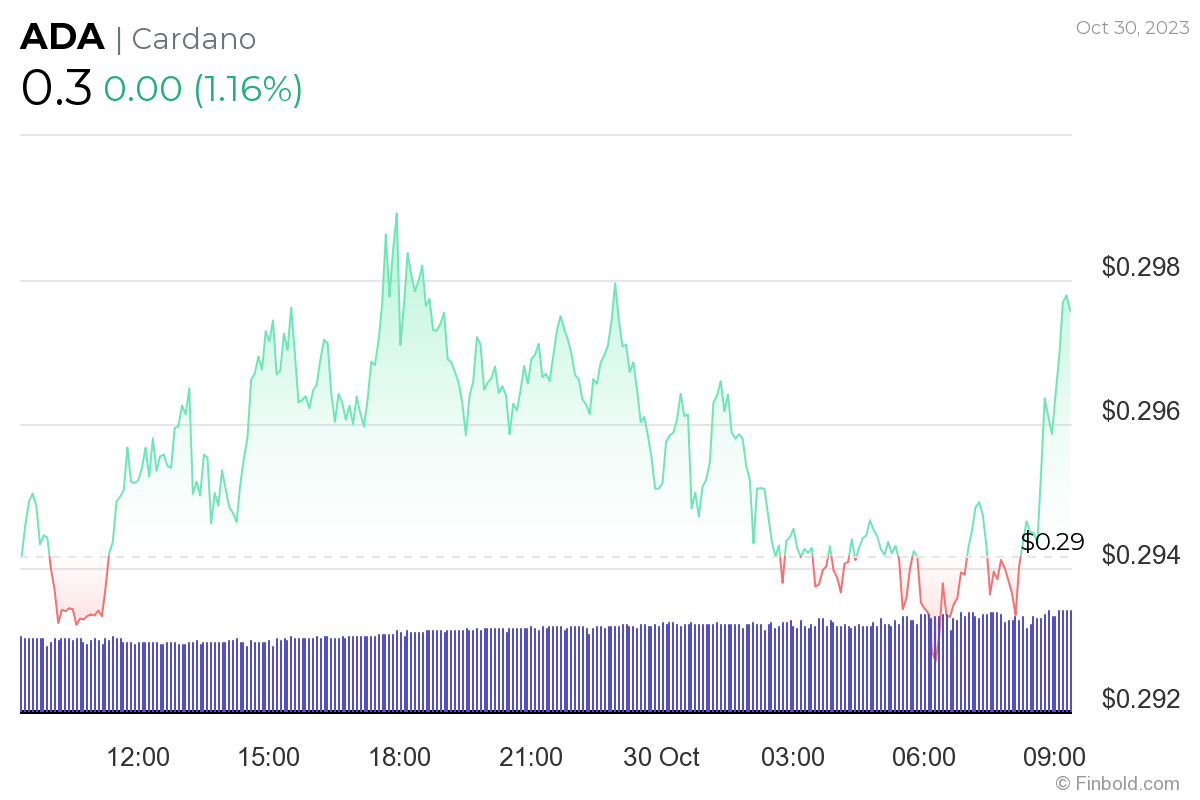
Indeed, Cardano has seen an impressive recovery in the past two weeks, fueled by the formation of a double bottom, a generally bullish and positive chart pattern used in identifying and executing profitable trades, as well as a generally optimistic sentiment in the wider cryptocurrency market.
En effet, Cardano a connu une reprise impressionnante au cours des deux dernières semaines, alimentée par la formation d'un double fond, une configuration graphique généralement haussière et positive utilisée pour identifier et exécuter des transactions rentables, ainsi qu'un sentiment généralement optimiste sur le marché plus large des cryptomonnaies. .
It is also worth noting that Cardano’s uptrend, following the possible correction predicted above, could continue thanks to other factors as well, such as the total value locked (TVL) in it nearing a massive milestone of $200 million, according to the data retrieved from blockchain analytics platform DeFi Llama on October 30.
Il convient également de noter que la tendance haussière de Cardano, suite à l'éventuelle correction prévue ci-dessus, pourrait également se poursuivre grâce à d'autres facteurs, tels que la valeur totale verrouillée (TVL) approchant le cap massif de 200 millions de dollars, selon les données extraites de plateforme d'analyse blockchain DeFi Llama le 30 octobre.
Disclaimer: The content on this site should not be considered investment advice. Investing is speculative. When investing, your capital is at risk.
Avertissement : Le contenu de ce site ne doit pas être considéré comme un conseil en investissement. L’investissement est spéculatif. Lorsque vous investissez, votre capital est en danger.
Source : https://thebittimes.com/doge-shib-and-ada-hint-at-correction-before-bullish-continuation-tbt68306.html


 DogeHome
 TheCoinrise Media
 Thecoinrepublic.com
 TheCoinrise Media
 TheCoinrise Media
 Cryptopolitan_News
 Coin Edition
 BlockchainReporter


