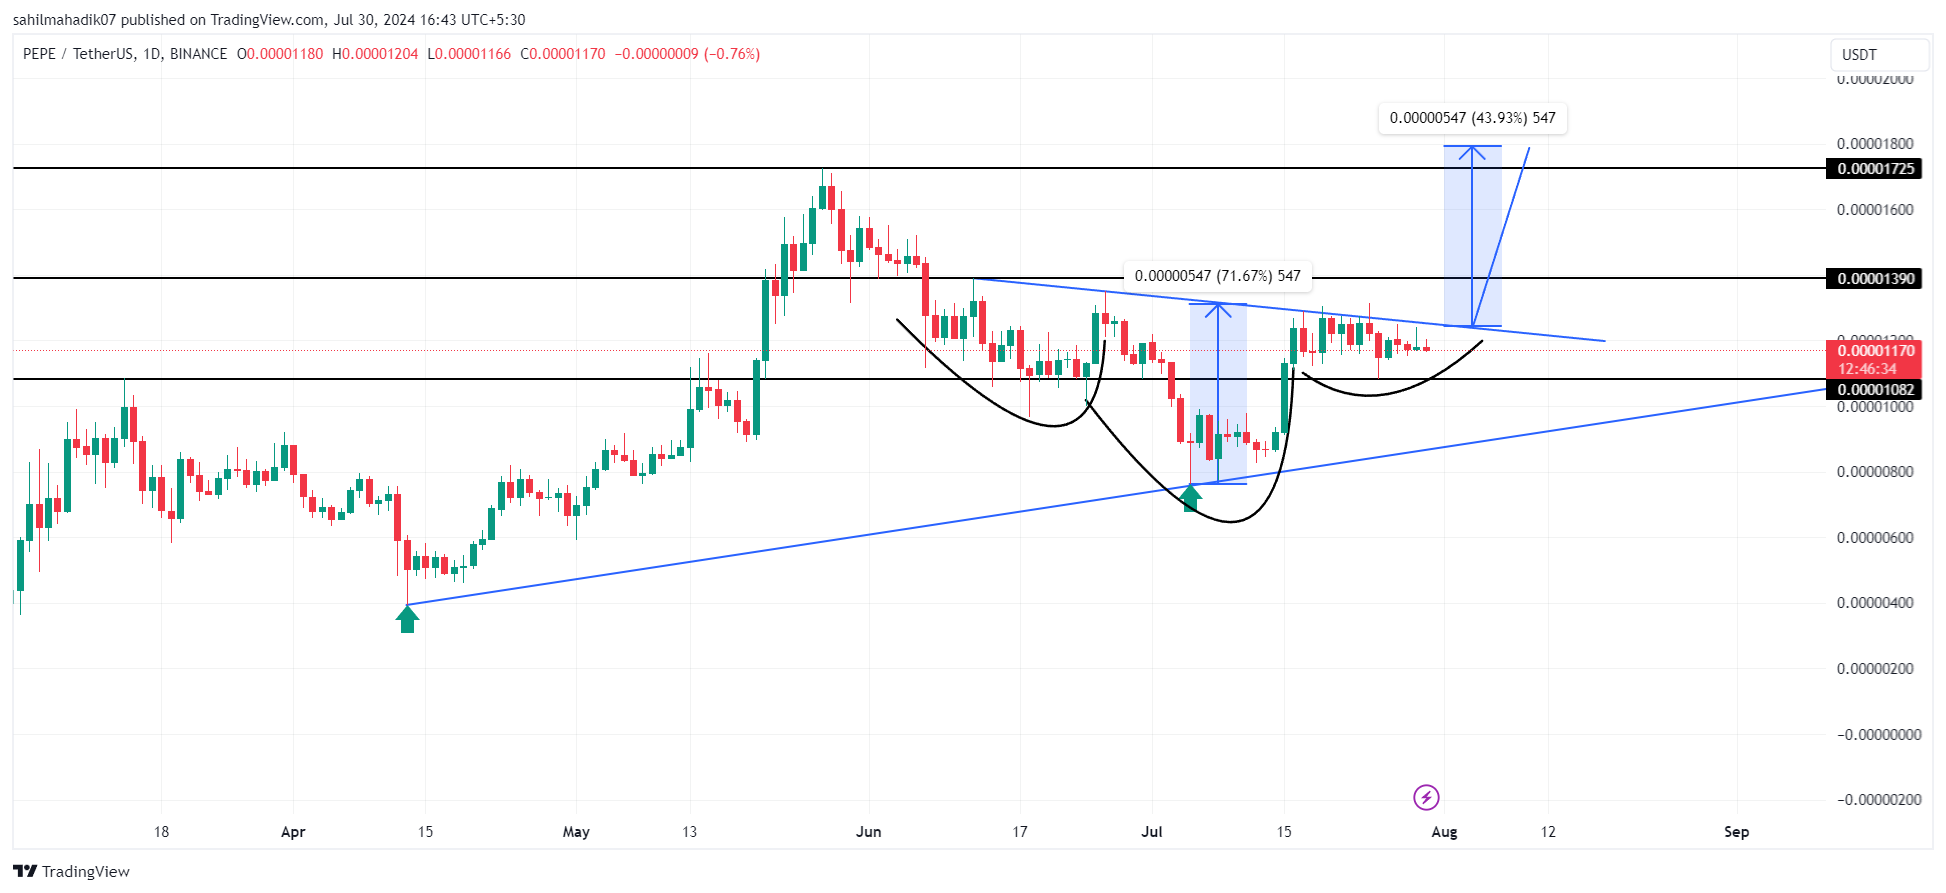
The crypto market commenced the new week on a bearish note, with Bitcoin abruptly declining to $66,700 on Monday. The BTC price encountered substantial resistance at $70,000, impeding the recovery in the altcoin market observed since last week. Amidst the sell-off, the Pepe coin recorded an intraday loss of 1% to reach $0.0000116, extending its breakout from the inverted head and shoulder pattern.
暗号通貨市場は新しい週を弱気で始まり、月曜日にはビットコインが66,700ドルまで突然下落した。 BTC価格は7万ドルで大きな抵抗線に遭遇し、先週から見られたアルトコイン市場の回復を妨げた。下落のさなか、ペペコインは日中1%の損失を記録して0.0000116ドルに達し、逆ヘッドアンドショルダーパターンからのブレイクアウトを延長した。
Further Reading: Breaking: US Government Transfers 29,800 Bitcoin From Silk Road
詳細情報: 速報: 米国政府がシルクロードから 29,800 ビットコインを送金
77% of PEPE Coin Holders in Profit: Is a Major Price Breakout Imminent?
PEPE コイン保有者の 77% が利益: 大規模な価格ブレイクアウトは差し迫っているのか?
Despite the general market recovery, the frog-themed meme coin PEPE exhibited a sluggish trend over the past two weeks. The daily chart's alternating green and red candles indicate indecision among buyers and sellers in driving the asset.
市場全体の回復にもかかわらず、カエルをテーマにしたミームコイン PEPE は過去 2 週間にわたって低迷傾向を示しました。日次チャートの緑と赤のローソク足が交互に現れるのは、資産の運用において買い手と売り手が優柔不断であることを示しています。
The RSI slope hovering at 50% reflects a neutral market sentiment.
RSI の傾きが 50% で推移しているのは、中立的な市場センチメントを反映しています。
However, a detailed technical analysis suggests that this consolidation period may be an accumulation trend preceding an inverted head-and-shoulder breakout. This bullish reversal pattern is typically identified at market bottoms and signals a shift in market sentiment with a new high-low formation.
しかし、詳細なテクニカル分析によれば、この値固め期間は、逆ヘッド・アンド・ショルダー・ブレイクアウトに先立つ蓄積傾向である可能性があることが示唆されています。この強気の反転パターンは通常、市場の底値で特定され、新たな高値と安値の形成による市場センチメントの変化を示します。

Pepe Coin| Tradingview
ペペコイン|トレーディングビュー
The PEPE coin currently trades at $0.0000116, with a market capitalization of $4.88 billion. A potential breakout from the neckline resistance would signal a significant reversal and provide support for a rally.
PEPEコインは現在0.0000116ドルで取引されており、時価総額は48億8000万ドルです。ネックラインのレジスタンスをブレイクアウトする可能性があれば、大幅な反転のシグナルとなり、上昇をサポートすることになるだろう。
Based on the chart dynamics, the post-breakout rally could elevate the asset by 40% to a new high of $0.000018.
チャートのダイナミクスに基づくと、ブレイクアウト後の上昇により資産は 40% 上昇し、新高値の 0.000018 ドルに達する可能性があります。
Further Reading: Breaking: Mt. Gox Readies Transfer of Remaining 80.5K Bitcoins, BTC Faces Pressure
詳細: 速報: マウントゴックスが残り8万5,000ビットコインの移転準備、BTCは圧力に直面
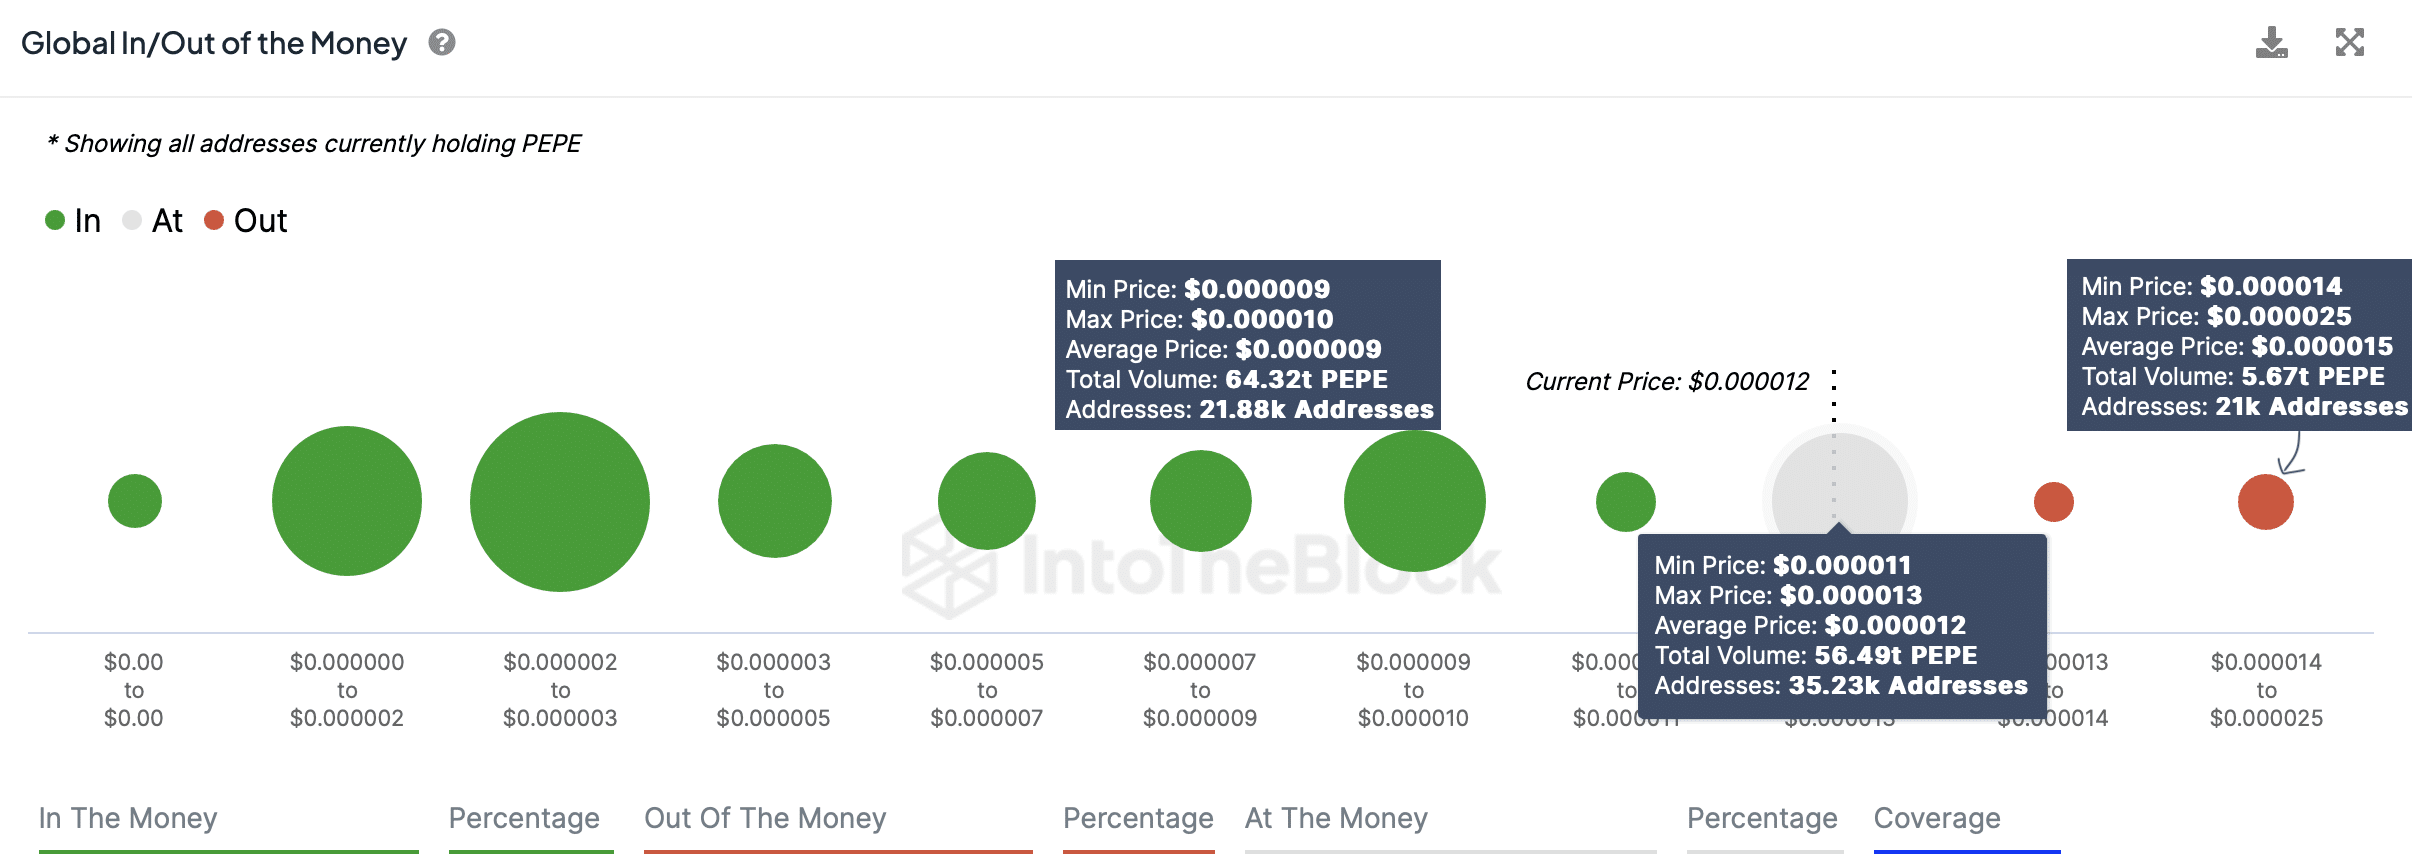
The Global In/Out of the Money (GIOM) metric for Pepe Coin suggests a positive outlook. Currently, 77% of PEPE coin addresses are 'in the money' (generating profits), while only 11% are 'out of the money' (incurring losses). This distribution implies potential price stability, as most investors are less likely to sell due to their profitable positions.
Pepe Coin の Global In/Out of the Money (GIOM) 指標は、前向きな見通しを示唆しています。現在、PEPE コイン アドレスの 77% は「イン ザ マネー」(利益を生み出している) ですが、「アウト オブ ザ マネー」(損失を被っている) なのは 11% のみです。ほとんどの投資家は利益を上げているポジションのために売却する可能性が低いため、この分布は潜在的な価格の安定を示唆しています。

GIOM Metric| Intotheblock
GIOM メトリック|イントゥザブロック
Approximately 35,230 addresses holding 56.5 trillion PEPE at prices ranging from $0.0000110 to $0.0000130 are at breakeven. A breakout from the Inverse Head and Shoulders (H&S) pattern would also push these holders into profit. The minimal red spheres on the GIOM chart indicate that there is limited resistance for PEPE to reach its all-time high.
0.0000110 ドルから 0.0000130 ドルの範囲の価格で 56.5 兆 PEPE を保持する約 35,230 のアドレスが損益分岐点にあります。インバース・ヘッド・アンド・ショルダーズ(H&S)パターンからのブレイクアウトも、これらの保有者を利益へと押し上げるだろう。 GIOM チャート上の最小限の赤い球は、PEPE が史上最高値に達するための抵抗力が限定されていることを示しています。
The 50D and 100D EMA徘徊在 0.0000108 美元附近,形成了强劲的买家支撑区域。因此,跌破该支撑可能使看涨论点失效,并使资产下跌 12% 至 2024 年 4 月以来的上升趋势线。
50Dおよび100D EMAは0.0000108ドル付近で推移しており、買い手にとって強力なサポートエリアを形成しています。したがって、このサポートを下回ると強気理論は無効となり、資産は2024年4月からの上昇トレンドラインまで12%下落する可能性があります。
对于买家而言,守住该支撑位至关重要,因为进一步突破可能导致重大回调。
さらなるブレイクアウトは大幅な下落につながる可能性があるため、買い手にとってこのサポートレベルを維持することが重要です。
文章 "Pepe Coin 已准备好攀升 40% 至 ATH?反转模式提供见解" 首次出现在 CoinGape 上。
記事「Pepe Coin Ready to Climb 40% to ATH? Reversal Pattern Offers Insights」は、CoinGape に初めて掲載されました。


 Crypto News Land
 TheNewsCrypto
 TNYR
TNYR Crypto Intelligence
 Crypto News Land
 DogeHome
 Crypto News Land
 DogeHome
 Crypto Intelligence


