Bitcoin Price Faces Correction Phase Amid Bearish Outlook
약세 전망 속에서 비트코인 가격은 조정 단계에 직면
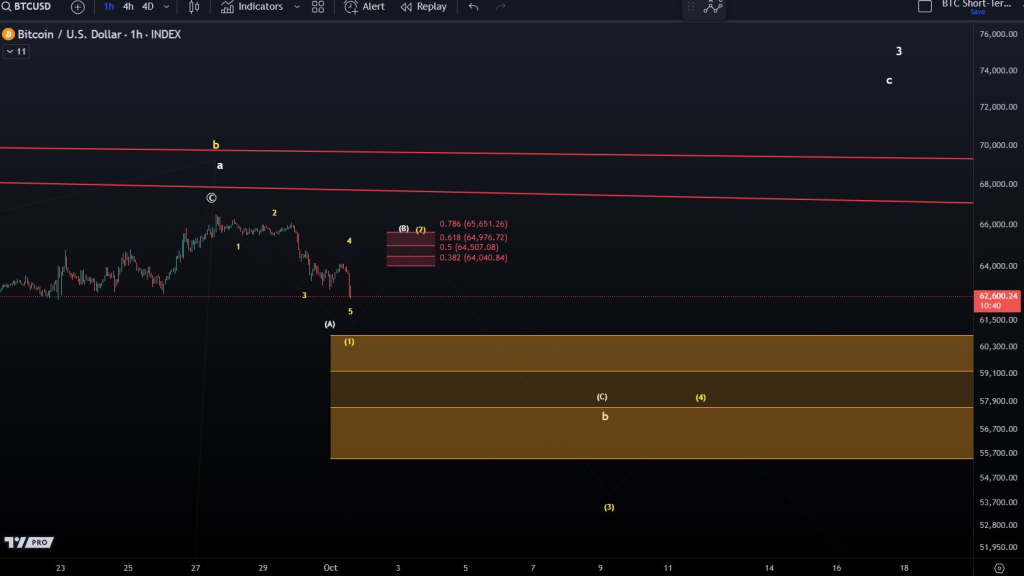
According to technical analysis by MoreCryptoOnline, Bitcoin (BTC) has completed an impulsive downward move consisting of five waves. This suggests the start of a corrective phase known as wave (B) or (2), where the price retraces the recent decline.
MoreCryptoOnline의 기술적 분석에 따르면 비트코인(BTC)은 5개의 파동으로 구성된 충동적인 하향 움직임을 완료했습니다. 이는 가격이 최근 하락세를 되돌리는 파동 (B) 또는 (2)로 알려진 조정 단계의 시작을 의미합니다.
Key Resistance Levels
주요 저항 수준
After the completion of the fifth wave around $62,600, Bitcoin is expected to face resistance between $64,040 and $65,650 during the corrective phase. This range may act as a reversal point, potentially triggering selling pressure.
$62,600 정도의 다섯 번째 물결이 완료된 후 비트코인은 조정 단계에서 $64,040에서 $65,650 사이의 저항에 직면할 것으로 예상됩니다. 이 범위는 반전 지점으로 작용하여 잠재적으로 매도 압력을 유발할 수 있습니다.
Possible Scenarios
가능한 시나리오
MoreCryptoOnline outlines two potential scenarios:
MoreCryptoOnline은 두 가지 잠재적 시나리오를 간략하게 설명합니다.
White Scenario: Wider B-Wave Correction
백색 시나리오: 더 넓은 B파 보정
In this scenario, Bitcoin may experience a short-term recovery or sideways movement within the resistance range before resuming its downward trend. This implies a temporary price rebound within the ongoing corrective phase.
이 시나리오에서 비트코인은 하락 추세를 재개하기 전에 저항 범위 내에서 단기적인 회복 또는 횡보 움직임을 경험할 수 있습니다. 이는 진행 중인 조정 단계에서 일시적인 가격 반등을 의미합니다.
Yellow Scenario: Deeper Drop to $45,000
노란색 시나리오: $45,000까지 더 하락
If Bitcoin fails to break above the resistance zone, it could extend its decline and potentially reach $45,000. This scenario would indicate a more bearish outlook and a continuation of the broader downtrend.
비트코인이 저항대를 돌파하지 못하면 하락세가 연장되어 잠재적으로 $45,000에 도달할 수 있습니다. 이 시나리오는 더욱 약세적인 전망과 더 넓은 하락 추세가 지속됨을 나타냅니다.
Market Outlook
시장 전망
The market sentiment remains bearish, suggesting that a downward trend may continue after the correction is complete. Traders should closely monitor the resistance zone to gauge the strength of the correction and anticipate future price movements.
시장 심리는 여전히 약세를 보이고 있어 조정이 완료된 후에도 하락 추세가 지속될 수 있음을 시사합니다. 트레이더들은 조정 강도를 측정하고 향후 가격 변동을 예상하기 위해 저항 영역을 면밀히 모니터링해야 합니다.
Follow us on  for more updates on the cryptocurrency market.
암호화폐 시장에 대한 추가 업데이트를 보려면 팔로우하세요.


 DogeHome
 Inside Bitcoins
 CoinPedia News
 CoinPedia News
 CFN
CFN CoinPedia News
 Cointelegraph


