Following the Bitcoin Halving, the cryptocurrency market has seen a surge in volatility, suggesting heightened activity among buyers and sellers. Amidst this, memecoins present a mixed sentiment, reflecting uncertainty regarding future price movements.
비트코인 반감기 이후 암호화폐 시장의 변동성이 급증해 구매자와 판매자 사이의 활동이 높아졌음을 시사합니다. 이런 가운데 밈코인은 향후 가격 변동에 대한 불확실성을 반영하여 혼합된 정서를 제시합니다.
Dogecoin, the frontrunner in this category, is experiencing a downward trend, while Shiba Inu, the second-largest memecoin, has recently shown signs of a bullish trend in the 1D time frame. This has left investors pondering over which memecoin to prioritize for their investments this week.
이 카테고리의 선두주자인 Dogecoin은 하락 추세를 겪고 있는 반면, 두 번째로 큰 Memecoin인 Shiba Inu는 최근 1D 시간 프레임에서 강세 추세의 조짐을 보였습니다. 이로 인해 투자자들은 이번 주에 어떤 memecoin에 투자 우선 순위를 두어야 할지 고민하게 되었습니다.
Mixed Outlook for DOGE Price Amidst Market Volatility
Despite heightened market volatility, Dogecoin (DOGE) is exhibiting an inverted cup and handle pattern in the 1D time frame, signaling a bearish trajectory ahead. Over the past day, DOGE has experienced a 3.12% decline, with a 2.52% decrease over the last 30 days, indicating subdued buying and selling pressures.
시장 변동성 속에 DOGE 가격에 대한 엇갈린 전망 시장 변동성이 높아졌음에도 불구하고 Dogecoin(DOGE)은 1D 시간 프레임에서 반전된 컵 앤 핸들 패턴을 보여 앞으로 약세 궤적을 예고하고 있습니다. 지난 하루 동안 DOGE는 3.12% 하락을 경험했으며, 지난 30일 동안 2.52% 감소하여 매수 및 매도 압력이 완화되었음을 나타냅니다.

TradingView: DOGE/USDT
TradingView: DOGE/USDT
Technical indicators, notably the Moving Average Convergence Divergence (MACD), depict a consistent downtrend, suggesting a potential bullish convergence in the week ahead. However, the Exponential Moving Averages (EMA) 50/200-day signals bearish price action, reflecting mixed sentiments prevailing in the cryptocurrency space.
기술 지표, 특히 MACD(Moving Average Convergence Divergence)는 지속적인 하락 추세를 나타내며 앞으로 일주일 동안 강세 수렴 가능성이 있음을 시사합니다. 그러나 지수 이동 평균(EMA) 50/200일은 암호화폐 공간에 만연한 혼합 정서를 반영하여 약세 가격 움직임을 나타냅니다.
To maintain bullish momentum, DOGE must hold above the support level of $0.155, with a potential upward movement to test resistance at $0.182. Conversely, bearish market conditions could drive the price downward towards the support level of $0.128 in the near future.
강세 모멘텀을 유지하려면 DOGE는 $0.155의 지지 수준 이상을 유지해야 하며 $0.182의 저항을 테스트하기 위한 잠재적인 상승 움직임이 있어야 합니다. 반대로 약세 시장 상황으로 인해 가까운 시일 내에 가격이 $0.128의 지원 수준까지 하락할 수 있습니다.
SHIB Price Analysis: Bullish Momentum Amidst Increased Market Hype
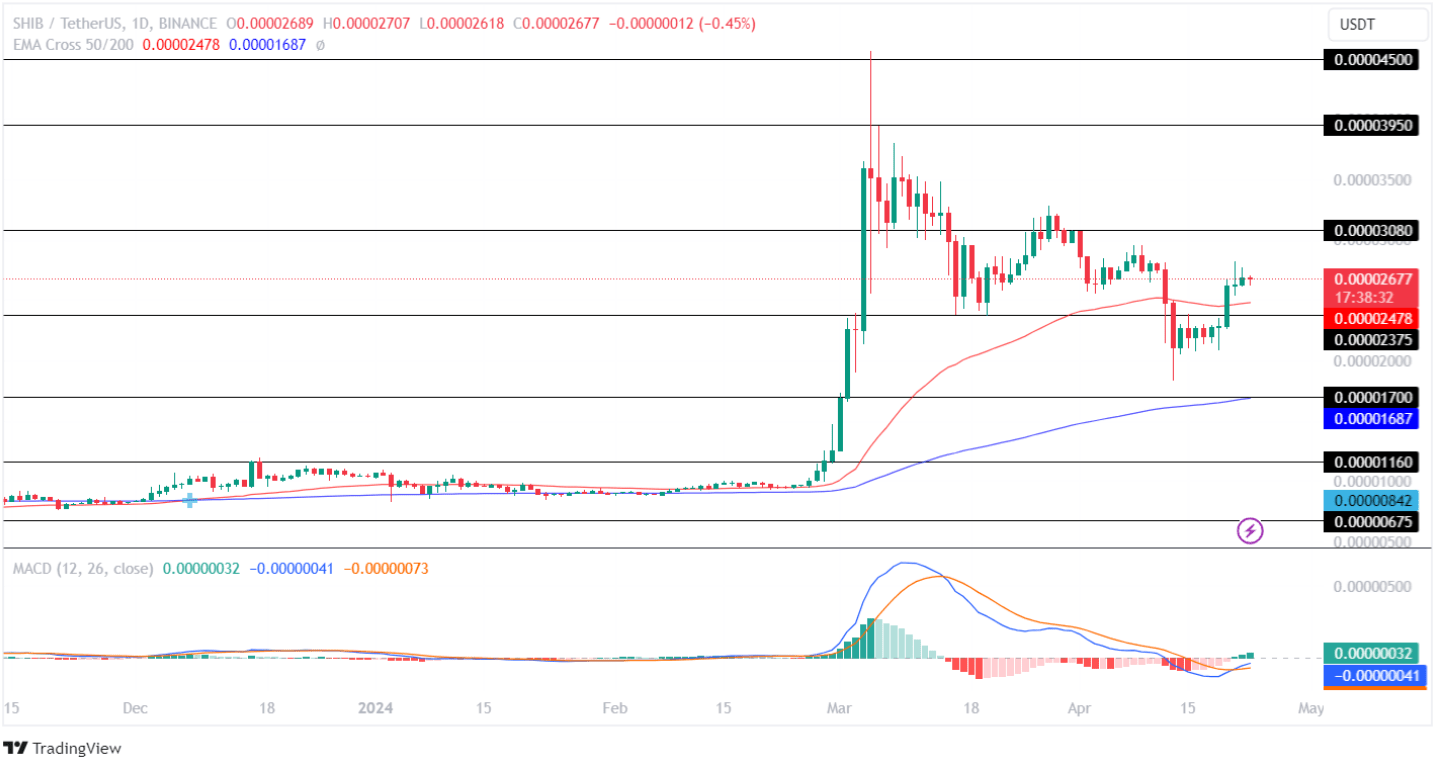
The Shiba Inu (SHIB) memecoin initially displayed a neutral trend in the first two months, signaling a slow start for this segment within the crypto market. However, as excitement around memecoins grew, SHIB experienced a breakout from its resistance level, witnessing a notable 3X surge within a short span.
SHIB 가격 분석: 증가하는 시장 과대 광고 속에서 강세 모멘텀 시바견(SHIB) 밈코인은 처음 두 달 동안 중립 추세를 보여 암호화폐 시장 내에서 이 부문의 느린 시작을 알렸습니다. 그러나 밈코인에 대한 관심이 커지면서 SHIB는 저항 수준에서 벗어나 단기간 내에 눈에 띄게 3배 급등하는 것을 경험했습니다.
Also Read: BONK and FLOKI Surge - 40% and 20% in 24 Hours
또한 읽어 보세요: BONK 및 FLOKI 급증 - 24시간 내에 40% 및 20%

TradingView: SHIB/USDT
트레이딩뷰: SHIB/USDT
Following rejection at the resistance level of $0.00003950, bullish momentum waned, leading to a breakdown of support levels. Subsequently, SHIB has been trading within the range of $0.000023 and $0.000030. Encouragingly, the EMA 50-day has emerged as a support level, indicating bullish potential within the crypto market.
$0.00003950의 저항 수준에서 거부된 후 강세 모멘텀이 약화되어 지원 수준이 무너졌습니다. 이후 SHIB는 $0.000023~$0.000030 범위 내에서 거래되었습니다. 다행스럽게도 EMA 50일은 지지 수준으로 등장하여 암호화폐 시장 내 강세 잠재력을 나타냈습니다.
Technical indicators, particularly the Moving Average Convergence Divergence (MACD), reveal a rising green histogram, suggesting increased buying pressure. Additionally, the MACD averages have recorded a bullish convergence, further supporting a positive outlook for the memecoin in the near term.
기술 지표, 특히 MACD(Moving Average Convergence Divergence)는 녹색 히스토그램이 상승하는 모습을 보여 매수 압력이 증가하고 있음을 나타냅니다. 또한 MACD 평균은 강세 수렴을 기록하여 단기적으로 memecoin에 대한 긍정적인 전망을 더욱 뒷받침합니다.
Should bullish momentum persist, SHIB price is poised to test its resistance level of $0.000030 in the current week. Conversely, a bearish reversal could lead to a price retracement towards the support level of $0.00002375.
강세 모멘텀이 지속될 경우 SHIB 가격은 이번 주에 $0.000030의 저항 수준을 테스트할 준비가 되어 있습니다. 반대로 약세 반전은 $0.00002375의 지원 수준을 향한 가격 되돌림으로 이어질 수 있습니다.
Important: Please note that this article is only meant to provide information and should not be taken as legal, tax, investment, financial, or any other type of advice.
중요: 이 문서는 정보 제공만을 목적으로 작성되었으며 법률, 세금, 투자, 금융 또는 기타 유형의 조언으로 받아들여서는 안 됩니다.


 CFN
CFN U_Today
 Thecoinrepublic.com
 DogeHome
 Optimisus
 Optimisus
 DeFi Planet
 Crypto Daily™
 BlockchainReporter


