The weekend is ending on a slow momentum, with markets consolidating. This is seen from the global market cap, which has jumped by 0.08% from its previous 24-hour one, as the total cap stood at $1.64T as of press time. The fear and greed index is 57, as the greed index dominates.
주말은 시장이 통합되면서 느린 모멘텀으로 마무리되고 있습니다. 이는 보도 시간 현재 글로벌 시가총액이 1.64조 달러로 이전 24시간 시가총액보다 0.08% 증가한 것을 보면 알 수 있습니다. 공포탐욕지수는 57로 탐욕지수가 압도적이다.
Bitcoin Price Analysis
Bitcoin (BTC) is showing mild recovery today as the Bitcoin price stood at $41.7K as of press time, representing a 0.7% pump in the last 24 hours to take the weekly drop to 2.4%. Bitcoin’s trading volume has dropped by 56% over the same period to stand at $9.8B.
비트코인 가격 분석비트코인(BTC)은 보도 시간 현재 비트코인 가격이 41.7K 달러로 지난 24시간 동안 0.7% 상승하여 주간 하락폭을 2.4%로 끌어내림에 따라 오늘 약간의 회복세를 보이고 있습니다. 비트코인 거래량은 같은 기간 동안 56% 감소한 98억 달러를 기록했습니다.
An in-depth analysis of 24-hour BTC/USD charts reveals a bull dominance. The Relative Strength Index indicator is moving north, showing bullish momentum on BTC. The MACD indicator, on the other hand, is reverting towards the green zone, showing failed bear pressure on the Bitcoin price.
24시간 BTC/USD 차트를 심층 분석한 결과 강세 우위가 드러났습니다. 상대강도지수(Relative Strength Index) 지표가 북쪽으로 움직이며 BTC의 강세 모멘텀을 보여주고 있습니다. 반면에 MACD 지표는 녹색 영역으로 되돌아가며 비트코인 가격에 대한 약세 압력이 실패했음을 보여줍니다.
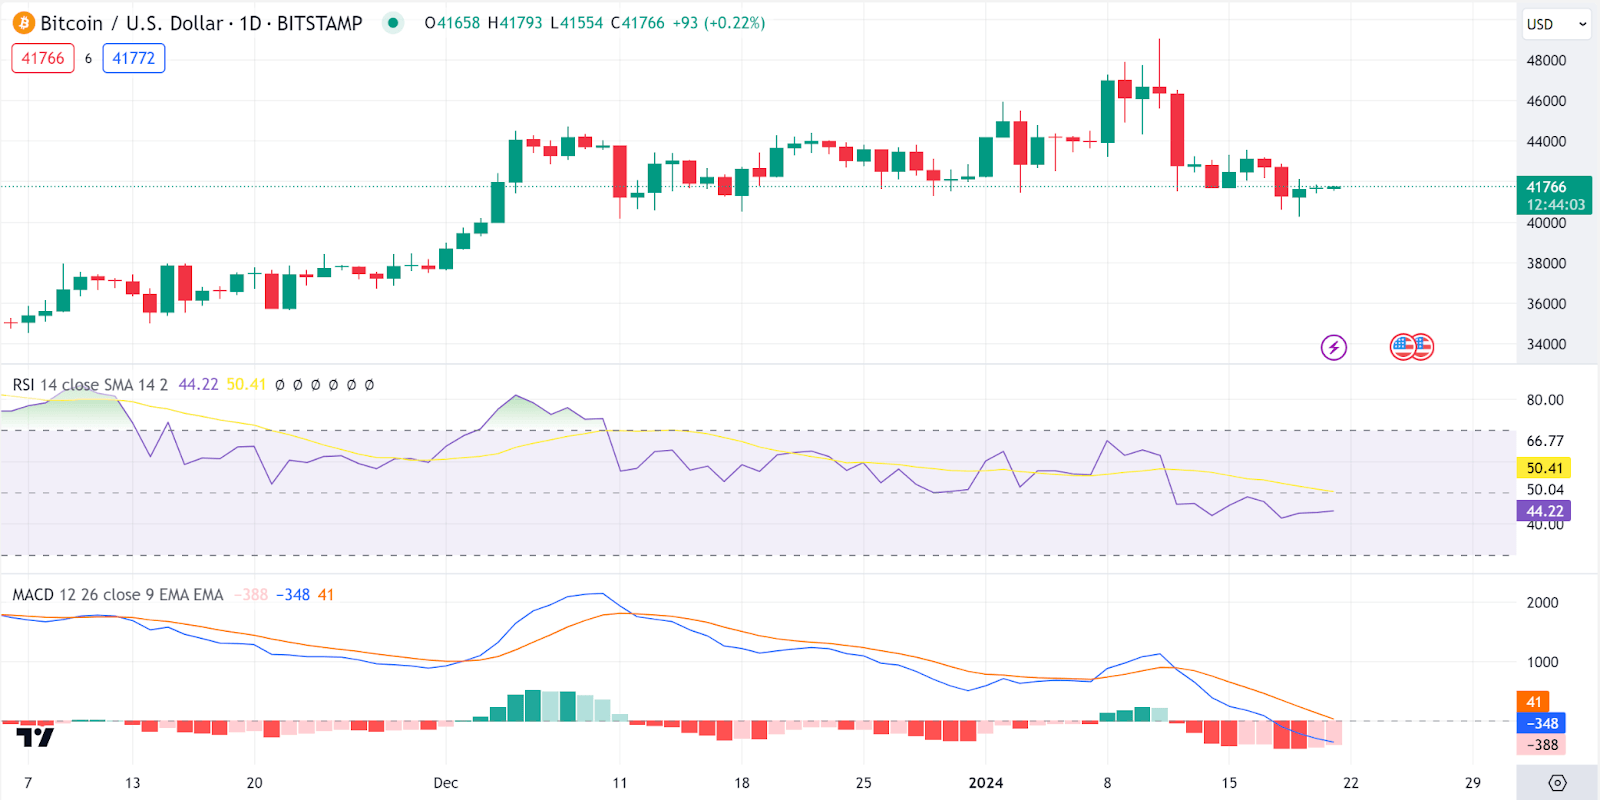 BTC 1-day chart | Source: TradingView
BTC 1일 차트 | 출처: TradingView
Ethereum Price Analysis
Ethereum (ETH) has also posted minor gains today as the Ethereum price stood at $2477 as of press time, representing a 0.4% increase in the last 24 hours as the weekly drop stood at 2.4%. The trading volume has dropped by 52% to $4.6B.
이더리움 가격 분석이더리움(ETH)도 오늘 이더리움 가격이 보도 시간 현재 2,477달러로 소폭 상승했습니다. 이는 주간 하락률이 2.4%로 지난 24시간 동안 0.4% 증가한 수치입니다. 거래량은 52% 감소한 46억 달러를 기록했습니다.
An in-depth analysis of the ETH/USD charts also shows a struggle between bulls and bears for ETH markets, as shown by the Relative Strength Index indicator, which is currently on a northern trajectory, showing bull pressure on the Ethereum price. On the other hand, the MACD indicator has shifted to the red zone, showing bearish prospects for the Ethereum price as well.
ETH/USD 차트에 대한 심층 분석은 현재 북방 궤적에 있는 상대 강도 지수(Relative Strength Index) 지표에서 알 수 있듯이 ETH 시장에 대한 강세와 약세 사이의 투쟁을 보여주며 이더리움 가격에 대한 강세 압력을 보여줍니다. 반면 MACD 지표는 레드존으로 이동해 이더리움 가격에 대한 약세 전망도 보이고 있다.
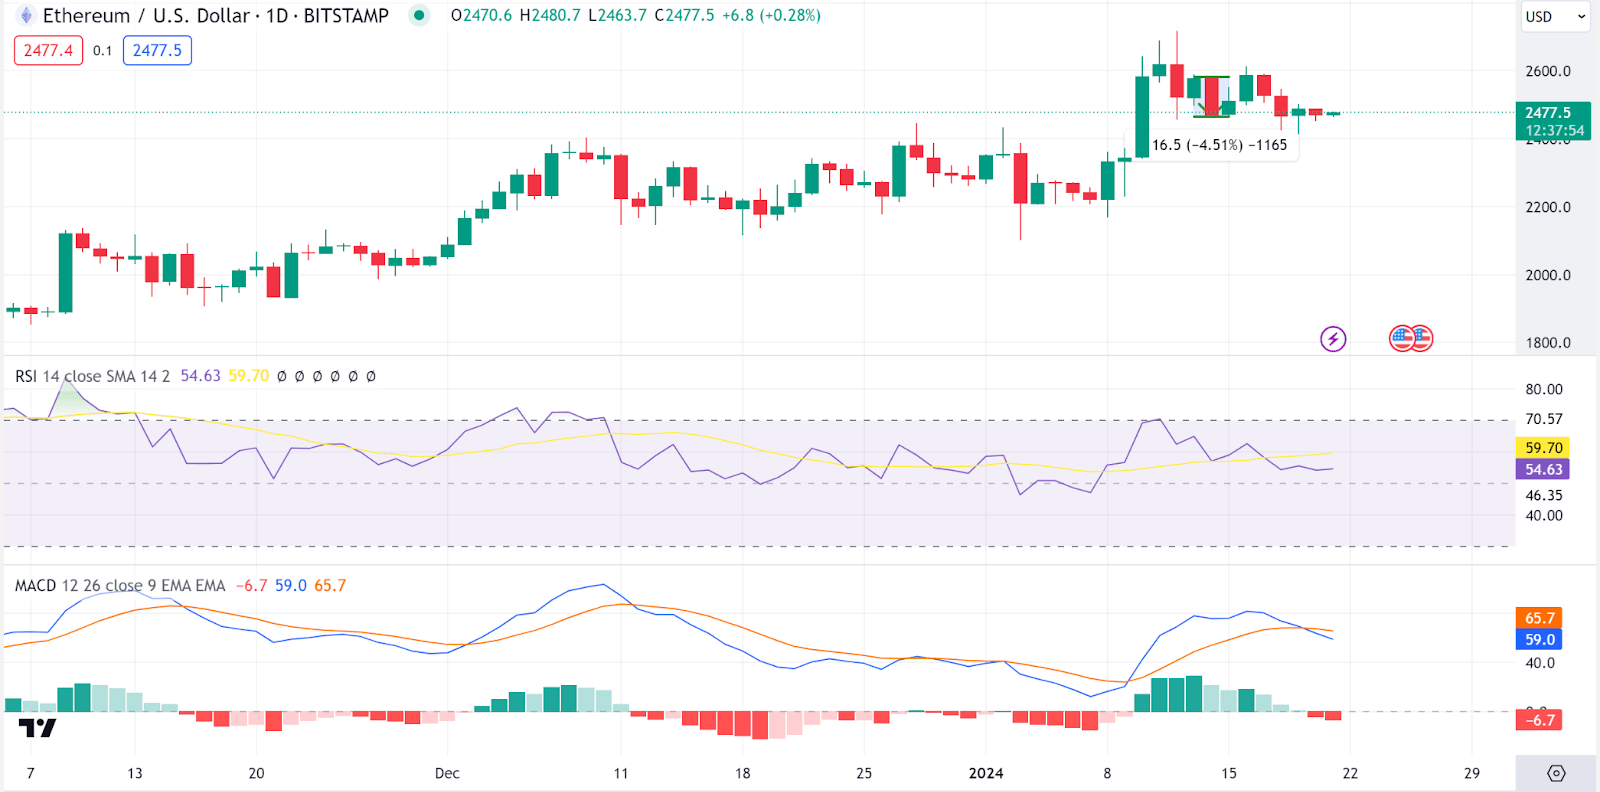 ETH 1-day chart | Source: TradingView
ETH 1일 차트 | 출처: TradingView
Celestia Price Analysis
Celestia (TIA) has also posted minor gains today as the Celestai price stood at $17.4 as of press time, representing a 0.9% increase in the last 24 hours as the weekly drop stood at 10.5%. The trading volume has dropped by 69% to $89M.
Celestia 가격 분석Celestia(TIA)도 오늘 Celestia 가격이 보도 시간 현재 17.4달러로 소폭 상승했습니다. 이는 주간 하락폭이 10.5%에 달해 지난 24시간 동안 0.9% 증가한 수치입니다. 거래량은 69% 감소한 8,900만 달러를 기록했습니다.
An in-depth analysis of the TIA/USDT charts points toward a pullback on the Celestia price, as shown by the Relative Strength Index indicator, which is currently on a southern trajectory, showing bear pressure on the Celestia price. On the other hand, the MACD indicator ismoving in the red zone, backing bearish prospects as well on the Celestia price.
TIA/USDT 차트에 대한 심층 분석은 현재 남쪽 궤적에 있는 상대 강도 지수(Relative Strength Index) 지표에서 알 수 있듯이 Celestia 가격에 대한 약세 압력을 보여주는 Celestia 가격의 하락을 가리킵니다. 반면에 MACD 지표는 빨간색 영역에서 움직이고 있으며 Celestia 가격에 대한 약세 전망을 뒷받침하고 있습니다.
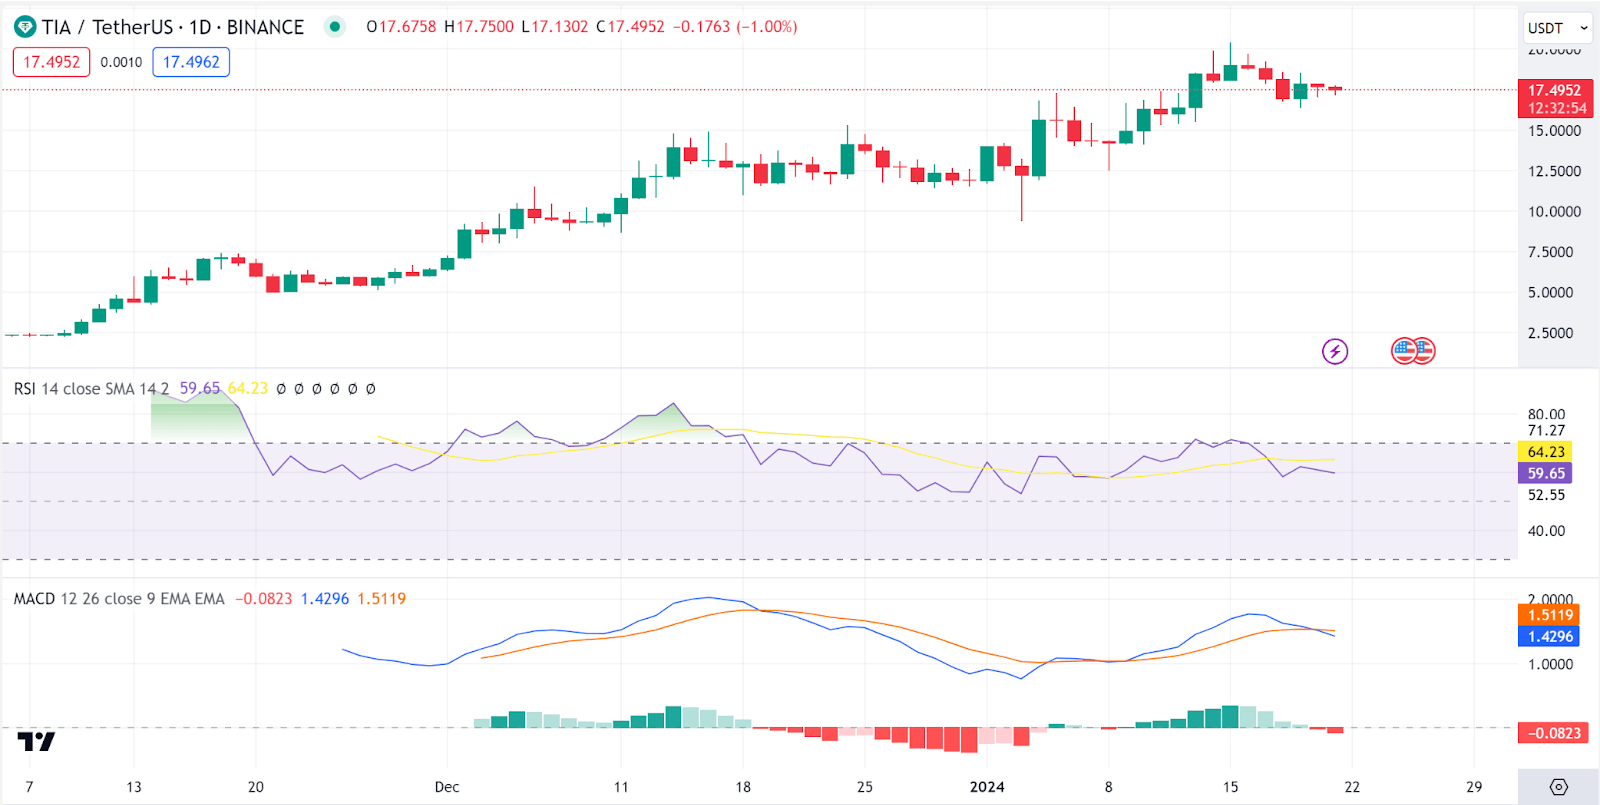 TIA 1-day chart | Source: TradingView
TIA 1일 차트 | 출처: TradingView
BNB Price Analysis
BNB (BNB) is another gainer today as the BNB price stood at $318 as of press time, representing a 1.4% increase in the last 24 hours to bring the weekly rise to 4.8%. The trading volume has dropped by 22% to $698M.
BNB 가격 분석BNB(BNB)는 보도 시간 현재 BNB 가격이 318달러로 지난 24시간 동안 1.4% 상승해 주간 상승률이 4.8%에 이르렀기 때문에 오늘 또 다른 상승세를 보였습니다. 거래량은 22% 감소한 6억 9,800만 달러를 기록했습니다.
An in-depth analysis of the BNB/USDT charts shows that bulls control the markets. This is shown by the Relative Strength Index indicator, which is currently on a northern trajectory as it heads for the overbought region, showing bull pressure on the BNB price. On the other hand, the MACD indicator is reverting toward the green zone, backing the bullish prospects on the BNB price.
BNB/USDT 차트를 심층적으로 분석한 결과 황소가 시장을 지배한다는 사실이 드러났습니다. 이는 현재 과매수 지역으로 향하면서 북쪽 궤적에 있는 상대 강도 지수(Relative Strength Index) 지표로 알 수 있으며, 이는 BNB 가격에 대한 강세 압력을 보여줍니다. 반면 MACD 지표는 녹색 영역으로 되돌아가며 BNB 가격에 대한 낙관적인 전망을 뒷받침하고 있습니다.
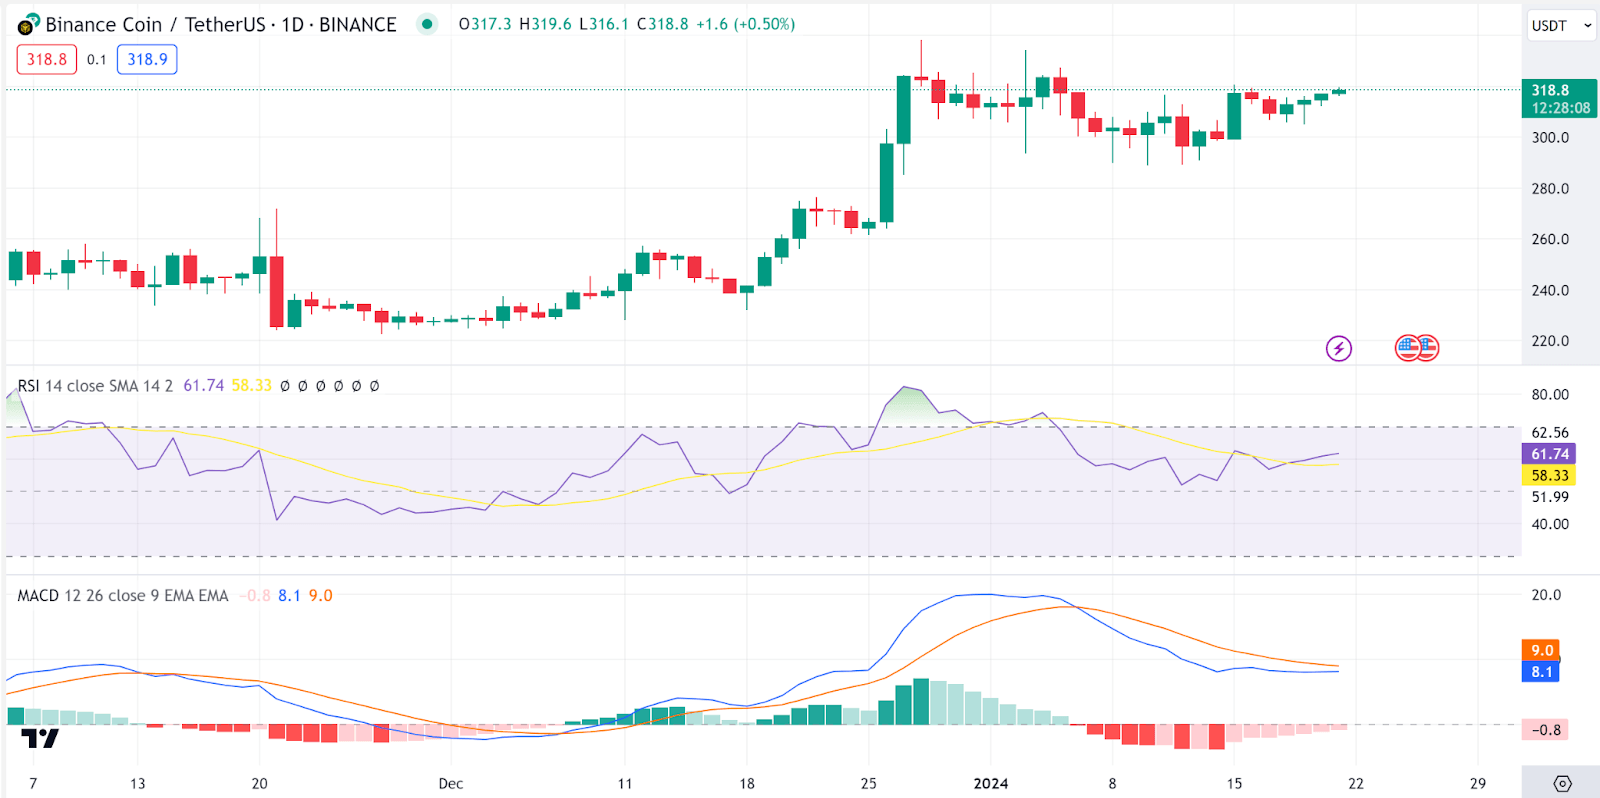 BNB 1-day chart | Source: TradingView
BNB 1일 차트 | 출처: TradingView
Dogecoin Price Analysis
Dogecoin (DOGE) is our top gainer today as the Dogecoin price stood at $0.08694 as of press time, representing a 10% increase in the last 24 hours to bring the weekly rise to 4.4%. The trading volume has jumped by 254% to $1.2B.
Dogecoin 가격 분석Dogecoin(DOGE)은 보도 시간 현재 Dogecoin 가격이 0.08694달러로 지난 24시간 동안 10% 증가하여 주간 상승률이 4.4%에 이르렀기 때문에 오늘 가장 높은 상승세를 보였습니다. 거래량은 254% 증가한 12억 달러를 기록했습니다.
An in-depth analysis of the DOGE/USDT charts shows that bulls control the markets. This is shown by the Relative Strength Index indicator, which is currently above 50, showing bull pressure on the BNB price as the token still has time to become overbought. On the other hand, the MACD indicator has shifted to the green zone, backing the bullish prospects on the Dogecoin price.
DOGE/USDT 차트를 심층적으로 분석한 결과 황소가 시장을 지배한다는 사실이 드러났습니다. 이는 현재 50을 넘는 상대 강도 지수(Relative Strength Index) 지표로 알 수 있으며, 이는 토큰이 아직 과매수될 시간이 있기 때문에 BNB 가격에 대한 강세 압력을 보여줍니다. 반면 MACD 지표는 녹색 영역으로 이동하여 Dogecoin 가격에 대한 낙관적인 전망을 뒷받침했습니다.
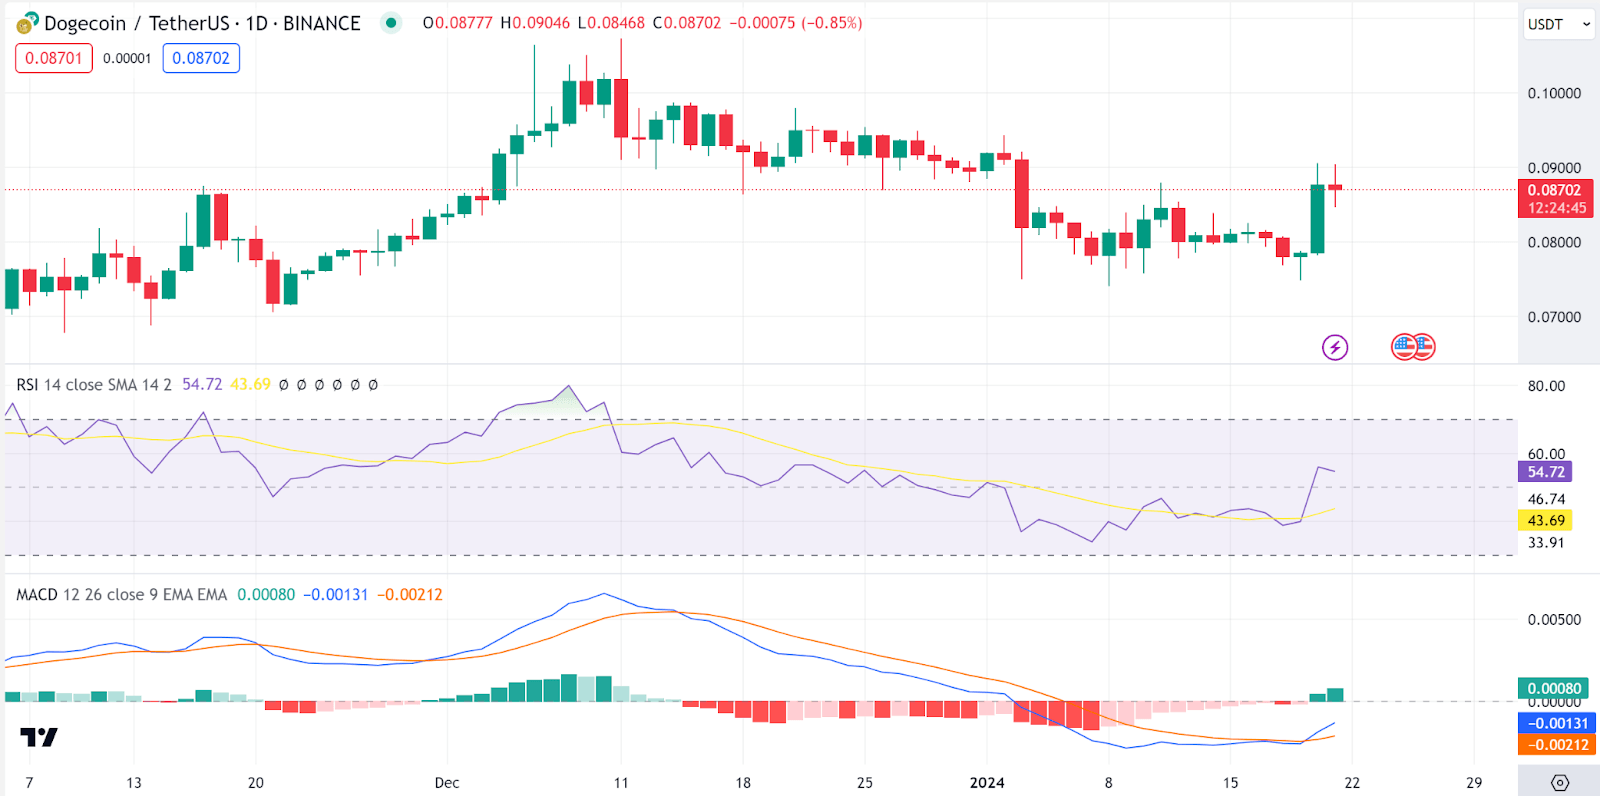 DOGE 1-day chart | Source: TradingView
DOGE 1일 차트 | 출처: TradingView


 DogeHome
 Crypto News Land
 ETHNews
 CFN
CFN U_Today
 Thecoinrepublic.com
 Optimisus
 Optimisus


