After a significant market rally, major cryptocurrencies are undergoing price adjustments. Amidst this, a renowned crypto expert took to X (formerly Twitter) to assert that the popular meme coin Dogecoin (DOGE) holds the potential to reach $10 in the coming year.
상당한 시장 랠리 이후 주요 암호화폐의 가격 조정이 진행되고 있습니다. 이런 가운데 유명한 암호화폐 전문가가 X(이전 트위터)를 통해 인기 밈 코인인 Dogecoin(DOGE)이 내년에 10달러에 도달할 가능성이 있다고 주장했습니다.
Expert Predicts $10 DOGE
전문가 예측 $10 DOGE
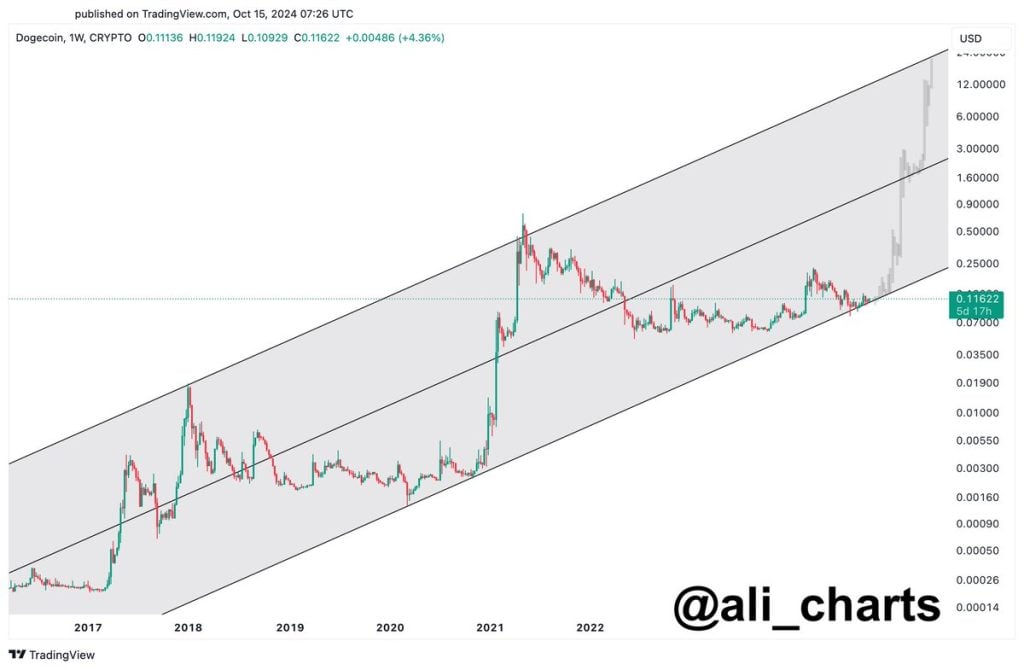
On X, the expert stated, "To anyone who claimed $10 Dogecoin was impossible — show them this chart." They shared a DOGE weekly chart, demonstrating the meme coin's movement within an ascending channel pattern, forming progressively higher highs and lows.
X에 대해 전문가는 "10달러 Dogecoin을 주장하는 사람에게는 불가능했습니다. 그들에게 이 차트를 보여주세요."라고 말했습니다. 그들은 DOGE 주간 차트를 공유하여 오름차순 채널 패턴 내에서 밈 코인의 움직임을 보여주고 점점 더 높은 고점과 저점을 형성했습니다.

Source: X (formerly Twitter)
출처: X(이전 트위터)
Upon examining the chart, it appears that DOGE is presently nearing a higher low, with the subsequent higher high anticipated around $10 or $12. This analysis formed the basis of the expert's statement. It is important to note that this prediction is long-term and may require years to materialize.
차트를 살펴보면 DOGE는 현재 더 높은 저점에 가까워지고 있으며 이후 더 높은 고점은 약 $10 또는 $12로 예상됩니다. 이 분석은 전문가 진술의 기초를 형성했습니다. 이 예측은 장기적이며 실현되기까지 수년이 걸릴 수 있다는 점에 유의하는 것이 중요합니다.
Current Price Momentum
현재 가격 모멘텀
At the time of writing, DOGE is trading near $0.114 and has experienced a moderate price decline of over 1.5% within the past 24 hours. During this period, its trading volume has surged by 37%, indicating heightened participation from traders and investors, possibly influenced by the upcoming presidential election in the United States.
이 글을 쓰는 시점에서 DOGE는 0.114달러 근처에서 거래되고 있으며 지난 24시간 동안 1.5% 이상의 적당한 가격 하락을 경험했습니다. 이 기간 동안 거래량이 37% 급증했는데, 이는 다가오는 미국 대통령 선거의 영향으로 트레이더와 투자자의 참여가 높아졌음을 의미합니다.
Technical Analysis and Future Levels
기술적 분석 및 향후 수준
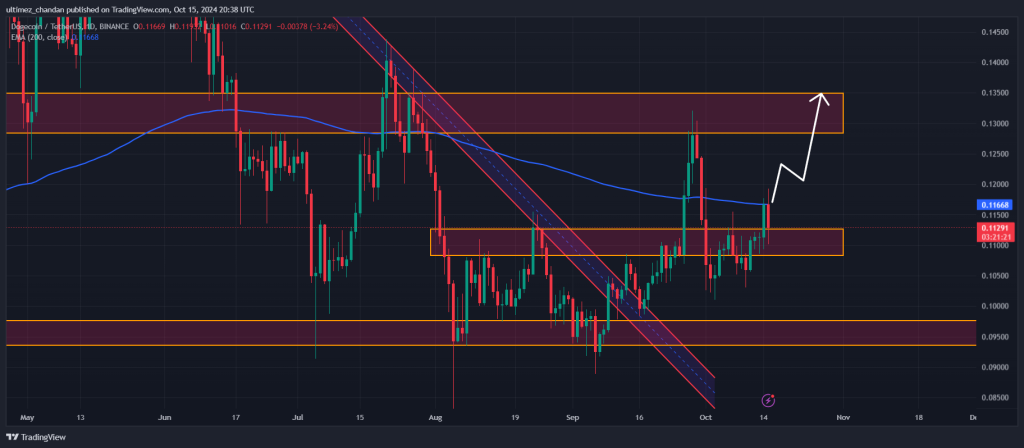
CoinPedia's technical analysis reveals that DOGE recently broke above the neckline of a bullish double-bottom price action pattern. However, with the ongoing price correction, it appears to have successfully retested this breakout level near $0.112 and is currently facing resistance from the 200-day Exponential Moving Average (EMA).
CoinPedia의 기술적 분석에 따르면 DOGE는 최근 강세 이중 바닥 가격 행동 패턴의 네크라인을 돌파했습니다. 그러나 지속적인 가격 조정으로 인해 $0.112 근처에서 이 돌파 수준을 성공적으로 다시 테스트한 것으로 보이며 현재 200일 지수 이동 평균(EMA)의 저항에 직면하고 있습니다.

Source: Trading View
출처: 트레이딩 뷰
Based on historical price momentum, if DOGE closes a daily candle above $0.118, there is a substantial possibility of a 20% surge to reach $0.135 in the upcoming days. Furthermore, DOGE's Relative Strength Index (RSI) supports this positive outlook, as it is currently indicating an oversold condition, potentially signaling a strong price recovery or rally.
역사적 가격 모멘텀을 기준으로 DOGE가 일일 캔들을 $0.118 이상으로 마감하면 향후 며칠 동안 20% 급등하여 $0.135에 도달할 가능성이 상당히 높습니다. 또한 DOGE의 상대강도지수(RSI)는 현재 과매도 상태를 나타내고 있으며 잠재적으로 강력한 가격 회복 또는 반등을 신호하고 있기 때문에 이러한 긍정적인 전망을 뒷받침합니다.


 Cryptopolitan
 DogeHome
 crypto.ro English
 Crypto News Land
 ETHNews
 CFN
CFN U_Today
 Thecoinrepublic.com


