Dogecoin Faces Potential Price Breakout
Dogecoin은 잠재적인 가격 돌파에 직면해 있습니다
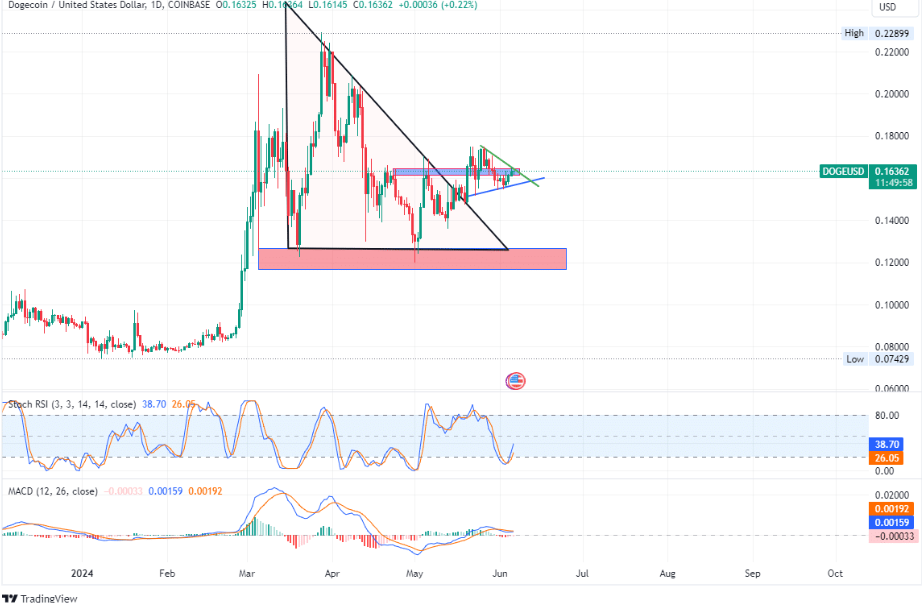
Dogecoin (DOGE) has been trading within a symmetrical triangle since breaking out of its ascending triangle formation on May 16. The price remains just below $0.16, approaching a potential breakout point at $0.163.
Dogecoin(DOGE)은 5월 16일 상승 삼각형 형성을 벗어난 이후 대칭 삼각형 내에서 거래되고 있습니다. 가격은 $0.16 바로 아래에 있으며 $0.163의 잠재적 돌파점에 접근하고 있습니다.
Doge Price Levels
Doge 가격 수준
As per current data, Dogecoin remains around $0.16 after dropping 2.47% in the last 24 hours and 0.96% in the last 7 days.
현재 데이터에 따르면 Dogecoin은 지난 24시간 동안 2.47%, 지난 7일 동안 0.96% 하락한 후 약 0.16달러를 유지하고 있습니다.
The symmetrical triangle pattern suggests a potential breakout. If DOGE surpasses $0.163, the upward momentum may intensify.
대칭 삼각형 패턴은 잠재적인 돌파를 암시합니다. DOGE가 $0.163를 초과하면 상승 모멘텀이 강화될 수 있습니다.
The Stochastic RSI indicator is neutral, while the MACD indicator shows lines close together, indicating potential sideways movement before a clear trend emerges.
Stochastic RSI 지표는 중립적인 반면 MACD 지표는 선이 서로 가깝게 표시되어 명확한 추세가 나타나기 전에 잠재적인 횡보 움직임을 나타냅니다.
Dogecoin Comments
도지코인 댓글
Santiment data highlights:
Sentiment 데이터 하이라이트:
- Reduced price volatility suggests consolidation.
- Daily active addresses have declined from 65,000 to 29,100.
- Whale transactions remain stable, indicating large investors are not actively buying or selling.
Future of DOGE
감소된 가격 변동성은 통합을 시사합니다. 일일 활성 주소는 65,000에서 29,100으로 감소했습니다. 고래 거래는 안정적으로 유지되어 대규모 투자자가 적극적으로 구매하거나 판매하지 않음을 나타냅니다. DOGE의 미래
Negative market sentiment indicates bearish sentiment in the short term. Technical indicators suggest consolidation, while on-chain data shows reduced activity.
부정적인 시장 정서는 단기적으로 약세 정서를 나타냅니다. 기술적 지표는 통합을 시사하는 반면, 온체인 데이터는 활동 감소를 보여줍니다.
Investors should monitor the $0.163 level closely. A breakout could lead to higher prices, while consolidation may continue in the near term.
투자자들은 $0.163 수준을 면밀히 모니터링해야 합니다. 돌파는 가격 상승으로 이어질 수 있지만 단기적으로는 통합이 계속될 수 있습니다.


 DogeHome
 Cryptopolitan_News
 Coin Edition
 BlockchainReporter
 crypto.news
 Crypto Daily™
 BlockchainReporter
 Optimisus


